NIKE INC.
-
USD
(-)
- 15-min zeitverzögert - NYSE Aktien
| Eröffnung: | - |
| Veränderung: | - |
| Volumen: | - |
| Tief: | - |
| Hoch: | - |
| Hoch - Tief: | - |
| Typ: | Aktien |
| Ticker: | NKE |
| ISIN: |
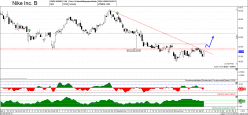
NIKE INC. - Täglich - Technische Analyse auf 01.12.2016 (GMT) veröffentlicht
- Wer hat abgestimmt?
- 814
- 0
- Chart + Richtung
- Richtung : Long
- |
- Long-Positionen oberhalb von : 51,75
- Zeiteinheit : Täglich
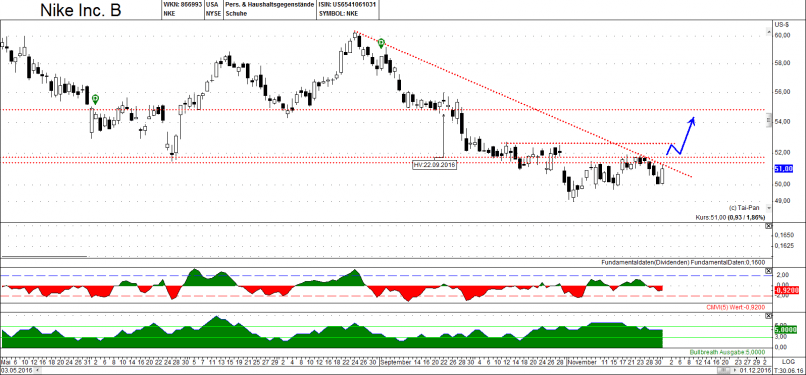
NIKE INC. Chart
Sind Sie auf der Suche nach Chancen bei US-Aktien?
Entdecken Sie Berolinia Opportunities...
Entdecken Sie Berolinia Opportunities...
Nike does present a nice setup opportunity. Prices have been consolidating lately.
There is a resistance zone just above at 51,40 US - 51,75 US.
Above this resistance zone may be a good entry point.
There is a resistance zone just above at 51,40 US - 51,75 US.
Above this resistance zone may be a good entry point.
Dieses Mitglied hat nicht erklärt, ob er eine Position bei diesem Finanzinstrument hat.
Über Nutzer

Offline


Kommentar hinzufügen
Kommentare
0 Kommentare zur Analyse NIKE INC. - Täglich