PROCTER & GAMBLE CO.
-
USD
(-)
- 15-min zeitverzögert - NYSE Aktien
| Eröffnung: | - |
| Veränderung: | - |
| Volumen: | - |
| Tief: | - |
| Hoch: | - |
| Hoch - Tief: | - |
| Typ: | Aktien |
| Ticker: | PG |
| ISIN: |
PROCTER & GAMBLE CO. - Täglich - Technische Analyse auf 17.11.2016 (GMT) veröffentlicht
- Wer hat abgestimmt?
- 858
- 0
- Chart + Richtung
- Richtung : Long
- |
- Long-Positionen oberhalb von : 84,65
- Zeiteinheit : Täglich

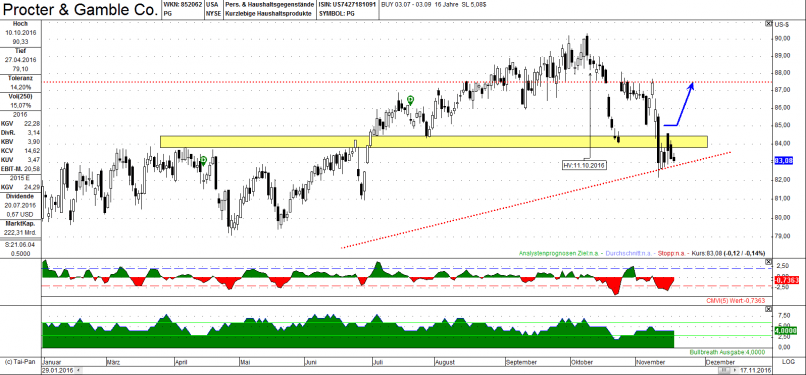
PROCTER & GAMBLE CO. Chart
Sind Sie auf der Suche nach Chancen bei US-Aktien?
Entdecken Sie Berolinia Opportunities...
Entdecken Sie Berolinia Opportunities...
Chart in $
The prices have been consolidating lately.
There is a resistance zone just above the current price starting at 84.65$.
Right above this resistance zone may be a good entry point.
There is a support zone below the current price at 83.70$.
Seasonal is PG in a upward trend until the end of 2016.
The prices have been consolidating lately.
There is a resistance zone just above the current price starting at 84.65$.
Right above this resistance zone may be a good entry point.
There is a support zone below the current price at 83.70$.
Seasonal is PG in a upward trend until the end of 2016.
Dieses Mitglied hat nicht erklärt, ob er eine Position bei diesem Finanzinstrument hat.
Über Nutzer

Offline


Kommentar hinzufügen
Kommentare
0 Kommentare zur Analyse PROCTER & GAMBLE CO. - Täglich