GOLD - USD
-
USD
(-)
- Echtzeitdaten - Gold & Silver Spot
| Eröffnung: | - |
| Veränderung: | - |
| Volumen: | - |
| Tief: | - |
| Hoch: | - |
| Hoch - Tief: | - |
| Typ: | Rohstoffe |
| Ticker: | XAUUSD |
| ISIN: |
GOLD - USD - Täglich - Technische Analyse auf 19.09.2016 (GMT) veröffentlicht
- Wer hat abgestimmt?
- 678
- 0
- Zeiteinheit : Täglich
GOLD - USD Chart
Sind Sie auf der Suche nach Index- und Forex-Chancen?
Entdecken Sie Berolinia Opportunities...
Entdecken Sie Berolinia Opportunities...
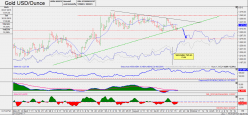
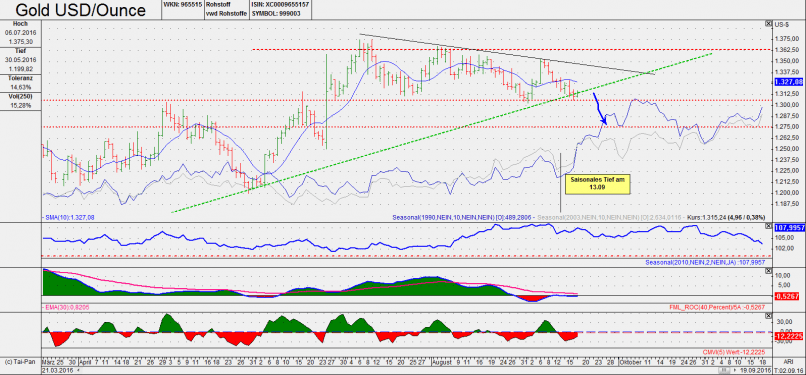
Gold is at an important support zone , which is $ 1306 - 1307 $. Will leave this down , then the area in 1275 could - 1281 are interesting.
Keeps the support could be a new upward movement into the area in 1335 - followed by $ 1345, then to $ 1,361
Some indicators are in oversold area and begin to turn.
Keeps the support could be a new upward movement into the area in 1335 - followed by $ 1345, then to $ 1,361
Some indicators are in oversold area and begin to turn.
Dieses Mitglied hat nicht erklärt, ob er eine Position bei diesem Finanzinstrument hat.
Über Nutzer

Offline


Kommentar hinzufügen
Kommentare
0 Kommentare zur Analyse GOLD - USD - Täglich