EASYJET ORD 27 2/7P - EasyJet Stock is Trading Within a Triangle - 12/27/2016 (GMT)
- Who voted?
- 1203
- 0
- Timeframe : Daily

EASYJET ORD 27 2/7P Chart
Are you looking for opportunities in European stocks?
DISCOVER LONDINIA OPPORTUNITIES...
DISCOVER LONDINIA OPPORTUNITIES...
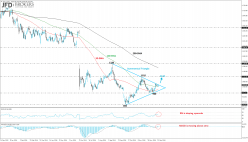
The Easy Jet (EZJ:LSE) is trading within a symmetrical triangle over the last three months after the sharp sell-off in June. The price opened with a gap to the downside and failed to recover it as it is developing near the $1031 price level.
The technical structure suggests further upside movement and a penetration of the upper band of the pattern. The price now is trading slightly below the latter level, however, it surpassed the 100-SMA on the daily chart. A break above the descending trend line will expose the price towards the $1110 strong resistance level. On the other hand, the stock may find a strong obstacle for the bulls and return back to the $960 support barrier. Technical indicators are moving in a positive area with some weak momentum. The RSI indicator is flattening above the 50 level while the MACD oscillator holds above both, its trigger and zero lines.
The technical structure suggests further upside movement and a penetration of the upper band of the pattern. The price now is trading slightly below the latter level, however, it surpassed the 100-SMA on the daily chart. A break above the descending trend line will expose the price towards the $1110 strong resistance level. On the other hand, the stock may find a strong obstacle for the bulls and return back to the $960 support barrier. Technical indicators are moving in a positive area with some weak momentum. The RSI indicator is flattening above the 50 level while the MACD oscillator holds above both, its trigger and zero lines.
This member did not declare if he had a position on this financial instrument or a related financial instrument.
About author

Offline


Add a comment
Comments
0 comments on the analysis EASYJET ORD 27 2/7P - Daily