MCDONALD S CORP. - McDonald's Stock Falling Hard, $115 Key - 08/02/2016 (GMT)
- Who voted?
- 897
- 0
- Timeframe : 4H
MCDONALD S CORP. Chart
Are you looking for opportunities in American stocks?
DISCOVER LONDINIA OPPORTUNITIES...
DISCOVER LONDINIA OPPORTUNITIES...
McDonald’s Corp (NYSE: MCD) is the world’s largest chain of fast food restaurants which its shares surged to an old-time high at $132 on May 10 and has since dropped down to $116. The shares of the company plunged more than 7% the last three months and recorded the third consecutive negative candle. The latest pressure on the MCDs shares came when the company reported weaker-than-expected same-store sales growth in the second quarter of 2016. Also, McDonald’s (MCD) reported its 2Q16 results on July 26, 2016. The company posted revenue of $6.3 billion and EPS (earnings per share) of $1.25. However, adjusted EPS stood at $1.45. Compared to 2Q15, its revenue declined by 3.6% while EPS grew by 21.8%.
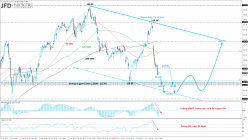
Technically, on the daily chart shows that the price is below the descending trendline, as well as below the bearish 200-SMA. In addition, the daily technical indicators head south below their mid-levels adding to the bearish picture. The stock has a major support around at $116.00 as well as the 38.2% Fibonacci retracement level which could act as a dynamic support in the near term. If they do so then we could wait for a descending triangle to appear on the daily chart. In the case of a break below the aforementioned obstacles then we should expect a downward sloping channel to start developing.
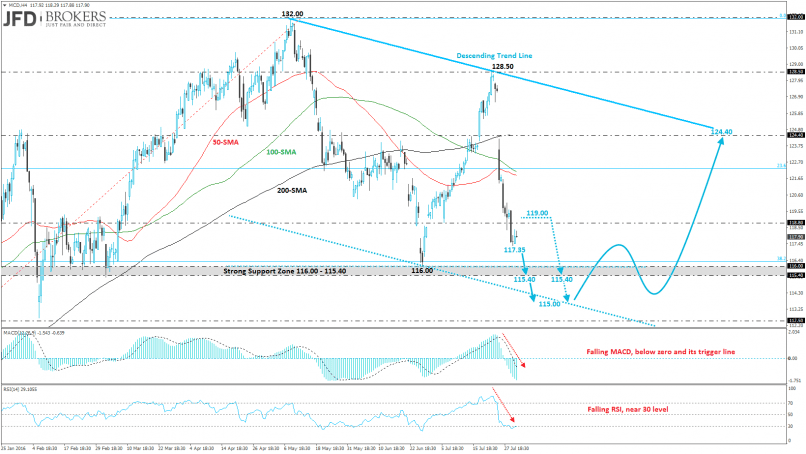
On the 4-hour chart, the price is below the three SMAs (200-SMA, 100-SMA, 50-SMA) and the technical indicators are falling into the oversold area. Meanwhile the 50-SMA cross below both the 100-SMA and 200-SMA adding further pressure to the stock. Having in mind the above I would expect to test the $116 price level or the $115 barrier. It depends which pattern will appear on the 4-hour / daily charts.
Technically, on the daily chart shows that the price is below the descending trendline, as well as below the bearish 200-SMA. In addition, the daily technical indicators head south below their mid-levels adding to the bearish picture. The stock has a major support around at $116.00 as well as the 38.2% Fibonacci retracement level which could act as a dynamic support in the near term. If they do so then we could wait for a descending triangle to appear on the daily chart. In the case of a break below the aforementioned obstacles then we should expect a downward sloping channel to start developing.
On the 4-hour chart, the price is below the three SMAs (200-SMA, 100-SMA, 50-SMA) and the technical indicators are falling into the oversold area. Meanwhile the 50-SMA cross below both the 100-SMA and 200-SMA adding further pressure to the stock. Having in mind the above I would expect to test the $116 price level or the $115 barrier. It depends which pattern will appear on the 4-hour / daily charts.
This member did not declare if he had a position on this financial instrument or a related financial instrument.
About author

Offline


Add a comment
Comments
0 comments on the analysis MCDONALD S CORP. - 4H