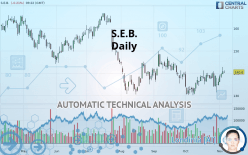
S.E.B. is part of a very strong bearish trend. Traders may consider trading only short positions (for sale) as long as the…
Status : INVALID
Simple chart
A slightly bearish trend and a neutral short term. With such a pattern, it is difficult to favour buying or selling. The…
Status : NEUTRAL
Simple chart
The strong short-term increase of S.E.B. should quickly allow the basic trend to become bullish. As long as the price remains…

Status : TARGET REACHED
Simple chart
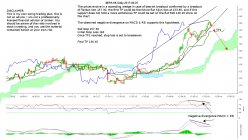
Tests the bottom of its rising wedge & Tenkan Sen…
The prices evolve in a ascending wedge in case of bearish breakout confirmed by a breakout of Tenkan Sen 157.30, the first TP…

Chart + Trading signal
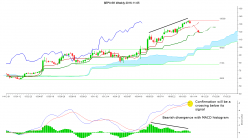
Bearish divergence with MACD histogram #Ichimoku
A bearish divergence with MACD histogram is appeared, a bearish confirmation will be done when the MACD line (Blue) will…

Chart + Trading signal