BRENT CRUDE OIL - Brent Crude Oil Rebound On 50-SMA - 08/11/2016 (GMT)
- Who voted?
- 682
- 0
- Timeframe : 4H
BRENT CRUDE OIL Chart
Are you looking for opportunities in indices and forex?
DISCOVER LONDINIA OPPORTUNITIES...
DISCOVER LONDINIA OPPORTUNITIES...
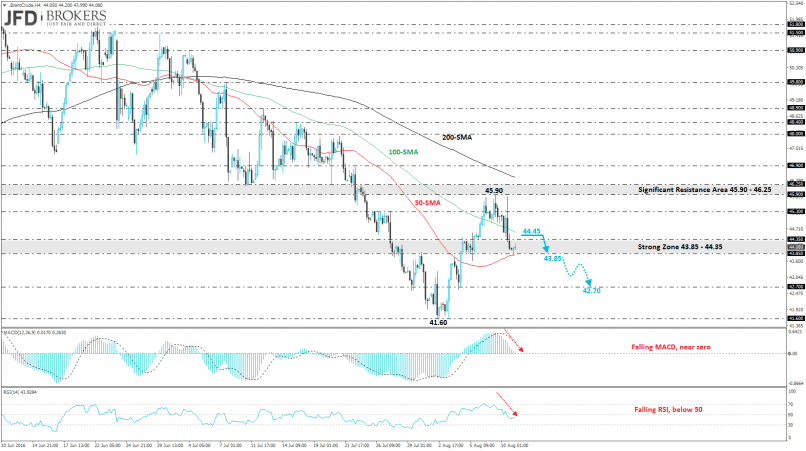
Oil prices dropped during yesterday’s period as crude inventories in the U.S. continued to expand over last week and in London, the fears over the global supply continued to strengthen following the fresh stockpile report. The Brent Crude Oil plummeted more than 3% the last two days, following the pullback from the $45.90 resistance level. The downward move came to an end when the price bounced off the 50-SMA on the 4-hour chart and now is creating a correction probably until the $44.35 support level or moreover until the 100-SMA on the 4-hour chart. Additionally, if the price plunge below the $43.85 price level will open the doors for the $42.70 barrier. The MACD oscillator is falling and is moving near the zero area whilst the RSI indicator fell to the negative zone below the 50 level.
This member did not declare if he had a position on this financial instrument or a related financial instrument.
About author

Offline


Add a comment
Comments
0 comments on the analysis BRENT CRUDE OIL - 4H