BRENT CRUDE OIL - Brent Recorded a New 17-Month High - 12/19/2016 (GMT)
- Who voted?
- 502
- 0
- Timeframe : 4H

BRENT CRUDE OIL Chart
Are you looking for opportunities in indices and forex?
DISCOVER LONDINIA OPPORTUNITIES...
DISCOVER LONDINIA OPPORTUNITIES...
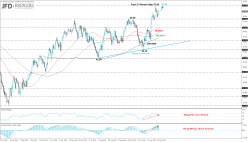
The Brent Crude Oil is moving higher, more than 14% so far the last two months, as well as it is recording the second positive month in a row. The oil is moving within an ascending move over the five months and during the previous week, it created a fresh 17-month high at $57.60.
The daily chart shows that the price is now moving well above the three SMAs (50-SMA, 100-SMA and 200-SMA) between the $47.00 and $53.50 barriers. The technical indicators are sloping upwards and they are moving above its mid-levels. The RSI indicator lies above the 50 level and is approaching the 70 barrier while the MACD oscillator is moving near its trigger line. For now, we would expect the pressure to remain to the upside as the technical structure suggests further upside movement until the latter level as the price moving near the $56.00 price level.
The daily chart shows that the price is now moving well above the three SMAs (50-SMA, 100-SMA and 200-SMA) between the $47.00 and $53.50 barriers. The technical indicators are sloping upwards and they are moving above its mid-levels. The RSI indicator lies above the 50 level and is approaching the 70 barrier while the MACD oscillator is moving near its trigger line. For now, we would expect the pressure to remain to the upside as the technical structure suggests further upside movement until the latter level as the price moving near the $56.00 price level.
This member did not declare if he had a position on this financial instrument or a related financial instrument.
About author

Offline


Add a comment
Comments
0 comments on the analysis BRENT CRUDE OIL - 4H