WTI CRUDE OIL - WTI Fell Below the $54.00 Critical Level - 12/27/2016 (GMT)
- Who voted?
- 622
- 0
- Timeframe : Daily

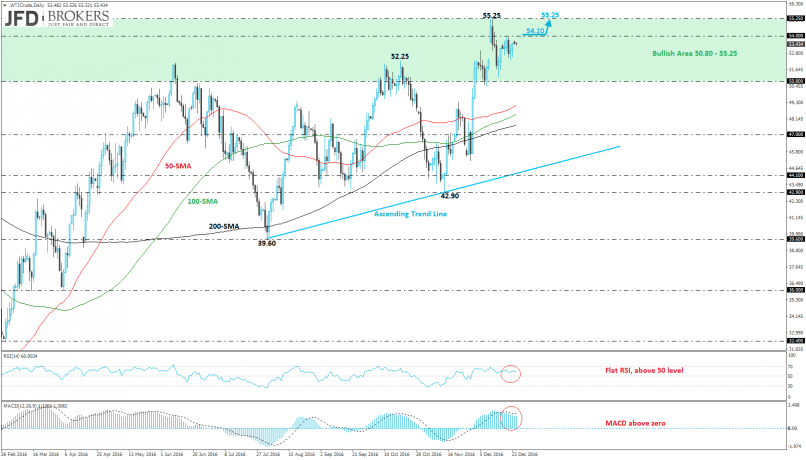
WTI CRUDE OIL Chart
Are you looking for opportunities in indices and forex?
DISCOVER LONDINIA OPPORTUNITIES...
DISCOVER LONDINIA OPPORTUNITIES...
Oil prices are trading sideways pre-New Year holiday trading session with markets adopting a wait-and-see stance less than a week before the first output cut deal agreed between OPEC and non-OPEC member in 15 years is scheduled to start.
The West Texas Intermediate (WTI) crude oil is looking bullish in the short-term timeframe, as well as, on the medium-term chart. The oil is creating an aggressive rally to the upside following the strong bounce off the 100-weekly SMA and is printing the second positive month in a row. The price is still developing in an ascending trend as it is trading well above the three SMAs (50-SMA, 100-SMA and 200-SMAs) on the daily chart, while the technical indicators lie on the positive territory. The RSI indicator is pointing upwards whilst the MACD oscillator holds below its trigger line and above the zero line. So, if the price surpasses the $54.00 strong psychological resistance barrier it will move towards the $55.25 level.
The West Texas Intermediate (WTI) crude oil is looking bullish in the short-term timeframe, as well as, on the medium-term chart. The oil is creating an aggressive rally to the upside following the strong bounce off the 100-weekly SMA and is printing the second positive month in a row. The price is still developing in an ascending trend as it is trading well above the three SMAs (50-SMA, 100-SMA and 200-SMAs) on the daily chart, while the technical indicators lie on the positive territory. The RSI indicator is pointing upwards whilst the MACD oscillator holds below its trigger line and above the zero line. So, if the price surpasses the $54.00 strong psychological resistance barrier it will move towards the $55.25 level.
This member did not declare if he had a position on this financial instrument or a related financial instrument.
About author

Offline


Add a comment
Comments
0 comments on the analysis WTI CRUDE OIL - Daily