GOLD - USD - Gold is Ready to Surpass $1,165 - 01/04/2017 (GMT)
- Who voted?
- 649
- 0
- Timeframe : Daily
GOLD - USD Chart
Are you looking for opportunities in indices and forex?
DISCOVER LONDINIA OPPORTUNITIES...
DISCOVER LONDINIA OPPORTUNITIES...
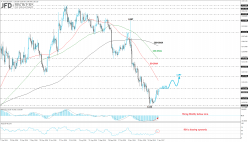
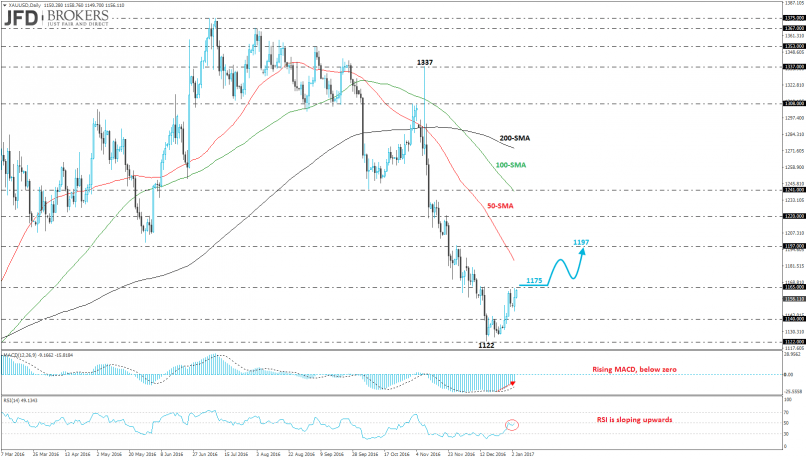
The precious metal added more than 9% to its value over the last year, however, it recorded the third red month in a row and met a fresh 11-month low at $1,122 support level. The XAU/USD pair is trading in a downward move following the bounce off the $1,375 resistance level.
On the short-term basis, the metal started a correction to the upside and if the price surpasses the $1,165 resistance barrier, it will open the door for the $1,197 handle which overlaps with the 100-weekly SMA but the 50-daily SMA seems to be an obstacle for the bulls. Technical indicators on the daily chart are biased higher as the MACD oscillator is rising and is approaching its mid-level. The RSI indicator is pointing upwards suggesting a stronger metal in the next few sessions.
On the short-term basis, the metal started a correction to the upside and if the price surpasses the $1,165 resistance barrier, it will open the door for the $1,197 handle which overlaps with the 100-weekly SMA but the 50-daily SMA seems to be an obstacle for the bulls. Technical indicators on the daily chart are biased higher as the MACD oscillator is rising and is approaching its mid-level. The RSI indicator is pointing upwards suggesting a stronger metal in the next few sessions.
This member did not declare if he had a position on this financial instrument or a related financial instrument.
About author

Offline


Add a comment
Comments
0 comments on the analysis GOLD - USD - Daily