SILVER - USD - Silver: The Market Opened With a Gap - 08/23/2016 (GMT)
- Who voted?
- 670
- 0
- Timeframe : Daily
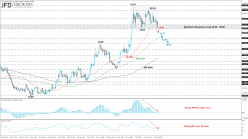
SILVER - USD Chart
Are you looking for opportunities in indices and forex?
DISCOVER LONDINIA OPPORTUNITIES...
DISCOVER LONDINIA OPPORTUNITIES...
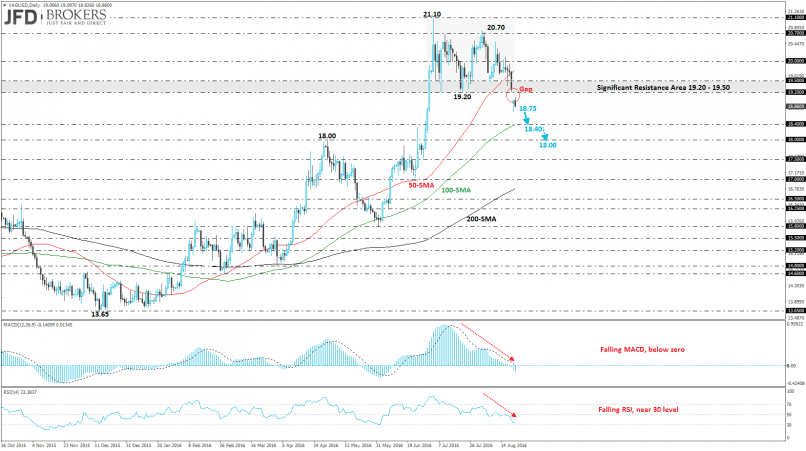
The XAG/USD edged sharply lower the previous week, as a result, the market to open with a gap below the strong resistance level at $19.20. Over the previous month, the metal recorded a 2-year high and challenged the $21.10 price level. After the retest of the latter level, the currency plunged more than 7% and met the $18.70 level.
From a technical point of view, the penetration of the significant barrier at $19.20 open the doors for the $18.40 barrier which overlaps with the 100-daily SMA. Furthermore, a break below the latter level will expose the price to the $18.00 psychological level. On the daily chart, technical indicators are endorsing our bearish thought, since the MACD oscillator entered the negative area during the last periods and the Relative Strength Index (RSI) is approaching the 30 level. Additionally, the price is moving below the 50-SMA and is moving towards to the 100-SMA. On a lower timeframe, the MACD and the RSI oscillators are following the oversold area with strong momentum
From a technical point of view, the penetration of the significant barrier at $19.20 open the doors for the $18.40 barrier which overlaps with the 100-daily SMA. Furthermore, a break below the latter level will expose the price to the $18.00 psychological level. On the daily chart, technical indicators are endorsing our bearish thought, since the MACD oscillator entered the negative area during the last periods and the Relative Strength Index (RSI) is approaching the 30 level. Additionally, the price is moving below the 50-SMA and is moving towards to the 100-SMA. On a lower timeframe, the MACD and the RSI oscillators are following the oversold area with strong momentum
This member did not declare if he had a position on this financial instrument or a related financial instrument.
About author

Offline


Add a comment
Comments
0 comments on the analysis SILVER - USD - Daily