AUD/USD - AUD/USD Fell and Reached the Suggested Target - 10/31/2016 (GMT)
- Who voted?
- 542
- 0
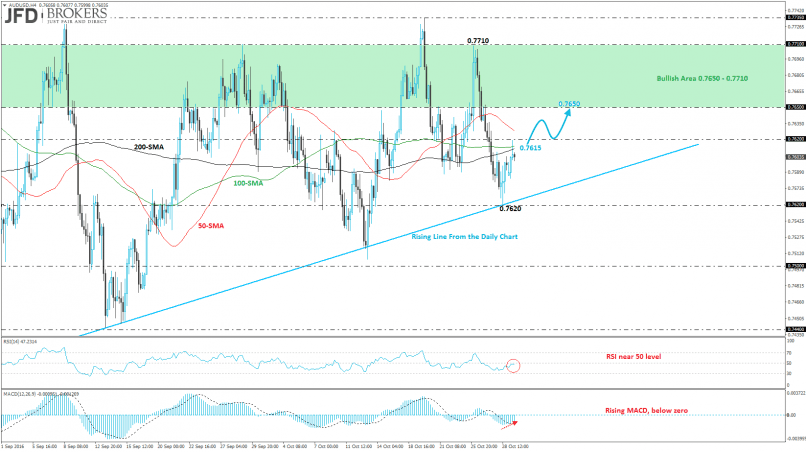
- Timeframe : 4H
AUD/USD Chart
Are you looking for opportunities in indices and forex?
DISCOVER LONDINIA OPPORTUNITIES...
DISCOVER LONDINIA OPPORTUNITIES...
The AUD/USD pair over last week jumped above the 0.7700 price level, however, it swiftly met resistance and ended the week below the recommended second target on a previous analysis at 0.7570 (see the analysis here: http://bit.ly/2eZj7tM). Also, the pair retested the ascending trend line which is holding since January.
Technically, after the rebound on the rising line the pair now is moving near the 0.7600 psychological level and below the three SMAs (50-SMA, 100-SMA and 200-SMA) on the 4-hour chart. However, on the daily chart, the commodity pair continues developing above the 50-SMA and 100-SMA on the daily chart endorsing the bullish attitude. The next level to watch is the 0.7650 resistance level, if the price surge above the three SMAs. Technical indicators are biased higher but they are still moving below their mid-levels. The MACD oscillator lies above its trigger line while the RSI indicator is flattening below the 50 level.
Technically, after the rebound on the rising line the pair now is moving near the 0.7600 psychological level and below the three SMAs (50-SMA, 100-SMA and 200-SMA) on the 4-hour chart. However, on the daily chart, the commodity pair continues developing above the 50-SMA and 100-SMA on the daily chart endorsing the bullish attitude. The next level to watch is the 0.7650 resistance level, if the price surge above the three SMAs. Technical indicators are biased higher but they are still moving below their mid-levels. The MACD oscillator lies above its trigger line while the RSI indicator is flattening below the 50 level.
This member did not declare if he had a position on this financial instrument or a related financial instrument.
About author

Offline


Add a comment
Comments
0 comments on the analysis AUD/USD - 4H