GBP/USD - GBP/USD is Developing Below 1.2310 - 12/30/2016 (GMT)
- Who voted?
- 372
- 0
- Timeframe : 4H
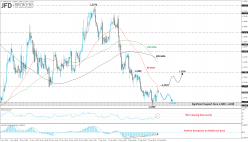

GBP/USD Chart
Are you looking for opportunities in indices and forex?
DISCOVER LONDINIA OPPORTUNITIES...
DISCOVER LONDINIA OPPORTUNITIES...
The GBP/USD pair edges higher and breached the 1.2310 resistance level following the strong bounce off the 1.2220 support barrier. The pair created a pullback on the 50-SMA on the 4-hour chart and now is trading near the 1.2280 price level. The next level to watch would be the 1.2220-1.2200 significant support zone. The moving averages are endorsing the bearish attitude as the 100-SMA crossed the 200-SMA to the downside while the RSI indicators is pointing downwards. A positive divergence has been observed in MACD and on price as the oscillator is rising while the price was moving lower. So, a correction to the upside will take place, if there is a penetration of the 1.2310 resistance barrier to the upside.
This member did not declare if he had a position on this financial instrument or a related financial instrument.
About author

Offline


Add a comment
Comments
0 comments on the analysis GBP/USD - 4H