GBP/USD - GBP/USD Slipped and Met New 2-Month Low - 01/04/2017 (GMT)
- Who voted?
- 359
- 0
- Timeframe : 4H
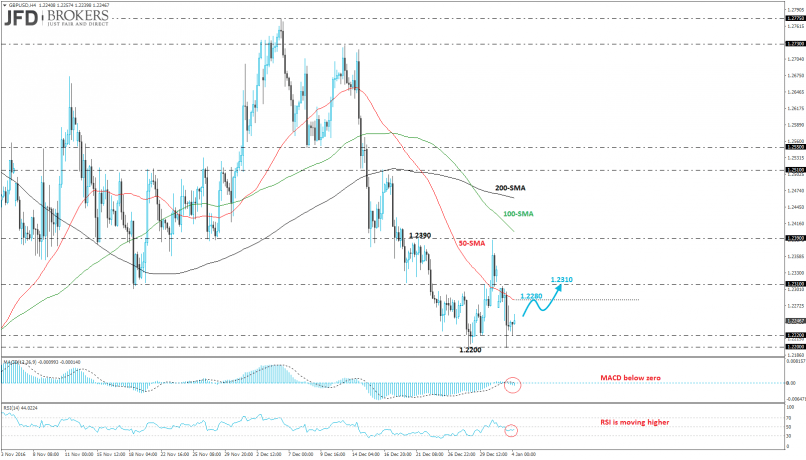
GBP/USD Chart
Are you looking for opportunities in indices and forex?
DISCOVER LONDINIA OPPORTUNITIES...
DISCOVER LONDINIA OPPORTUNITIES...
Sterling printed a two-month low versus the U.S. dollar before recovering some of its losses ending the day marginally to the downside. The GBP/USD pair hit the 1.2198 price level as the 50-SMA on the short-term timeframe seems to be a strong obstacle for the bears and the price failed to surpass the 1.2310 resistance barrier. Over the last two daily trading sessions, the pair slipped 0.8%, however, now is approaching 1.2310 again which is slightly below the 100-SMA on the 4-hour chart but first it must surpass above the 50-SMA. The MACD oscillator is holding below both its trigger and zero lines but with very weak momentum while the RSI indicator is moving towards the 50 level.
This member did not declare if he had a position on this financial instrument or a related financial instrument.
About author

Offline


Add a comment
Comments
0 comments on the analysis GBP/USD - 4H