GBP/USD - GBP/USD Rebounded on the 200-SMA (4H) - 01/20/2017 (GMT)
- Who voted?
- 499
- 0
- Timeframe : Daily

GBP/USD Chart
Are you looking for opportunities in indices and forex?
DISCOVER LONDINIA OPPORTUNITIES...
DISCOVER LONDINIA OPPORTUNITIES...
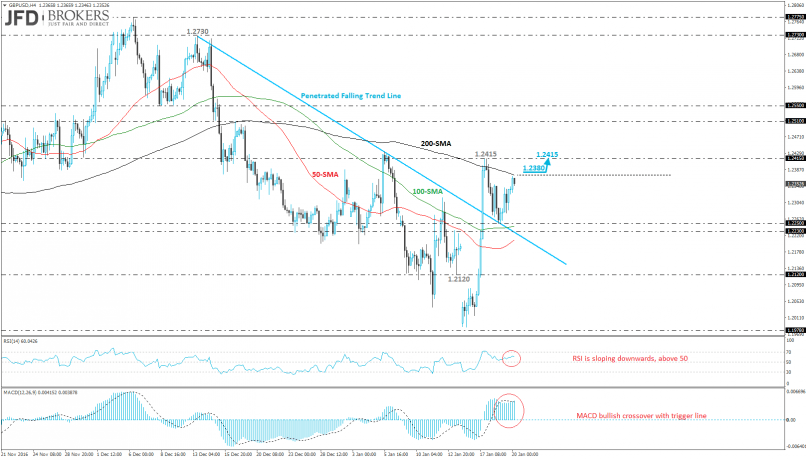
Sterling spent the entire Thursday’s trading session within a positive path versus the greenback following the bounce off the 1.2250 support barrier which overlaps with the descending trend line in the short-term timeframe. Currently, the price is trading within the 200 and 100 SMAs, so a penetration in either direction will drive the GBP/USD pair further up or down.
If the price surpasses the 200-SMA, it will retest the 1.2415 resistance barrier. Otherwise, if the pair slips below the 100-SMA and the strong support zone at 1.2230 – 1.2250, will expose the price at the 1.2120 obstacle. Technical indicators are moving sideways after the aggressive run to the upside on price. The MACD oscillator had a bullish crossover with its trigger line while the RSI indicator is moving within the bullish area but is pointing downwards.
If the price surpasses the 200-SMA, it will retest the 1.2415 resistance barrier. Otherwise, if the pair slips below the 100-SMA and the strong support zone at 1.2230 – 1.2250, will expose the price at the 1.2120 obstacle. Technical indicators are moving sideways after the aggressive run to the upside on price. The MACD oscillator had a bullish crossover with its trigger line while the RSI indicator is moving within the bullish area but is pointing downwards.
This member did not declare if he had a position on this financial instrument or a related financial instrument.
About author

Offline


Add a comment
Comments
0 comments on the analysis GBP/USD - Daily