NZD/USD - NZD/USD On Possible Correction - 08/08/2016 (GMT)
- Who voted?
- 608
- 0
- Timeframe : Daily

NZD/USD Chart
Are you looking for opportunities in indices and forex?
DISCOVER LONDINIA OPPORTUNITIES...
DISCOVER LONDINIA OPPORTUNITIES...
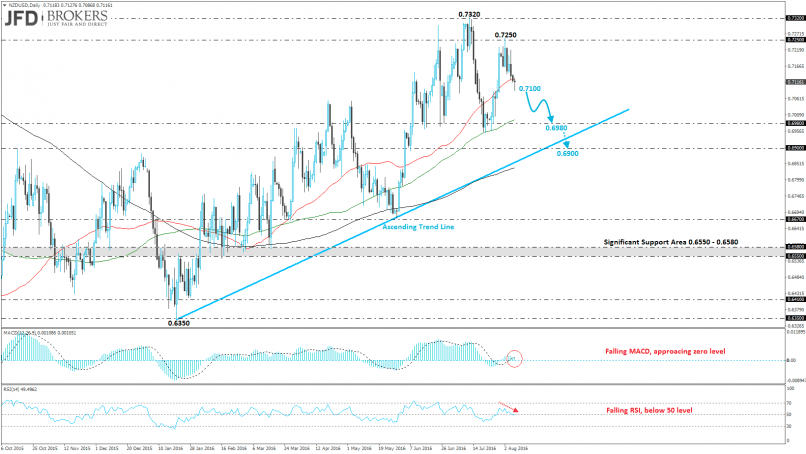
This week the Reserve Bank of New Zealand will have its monetary policy and is widely expected to end with a rate cut to 2.00% from 2.25%. During the previous week, the kiwi pair plunged more than 0.8% and met the 0.7080 price level after the rebound on 0.7250 price level.
Technically, the NZD/USD pair is currently trading above the 100-weekly SMA and below the 50-daily SMA. On the 4-hour chart, the price is moving between the three SMAs (50-SMA, 100-SMA, 200-SMA) and those obstacles will be a strong difficulty for the continuation of the ascending move. The pair is still trading above its uptrend line and a successful penetration below the 100-weekly SMA will be a good chance to retest the 0.6980 support level or moreover the bullish trend line. On the other hand, a failed attempt will expose the price until the 0.7250 resistance level. On the daily chart, the MACD oscillator is following a positive path but is approaching its mid-level. In addition, the RSI indicator is falling and dropped below the 50 level.
Technically, the NZD/USD pair is currently trading above the 100-weekly SMA and below the 50-daily SMA. On the 4-hour chart, the price is moving between the three SMAs (50-SMA, 100-SMA, 200-SMA) and those obstacles will be a strong difficulty for the continuation of the ascending move. The pair is still trading above its uptrend line and a successful penetration below the 100-weekly SMA will be a good chance to retest the 0.6980 support level or moreover the bullish trend line. On the other hand, a failed attempt will expose the price until the 0.7250 resistance level. On the daily chart, the MACD oscillator is following a positive path but is approaching its mid-level. In addition, the RSI indicator is falling and dropped below the 50 level.
This member did not declare if he had a position on this financial instrument or a related financial instrument.
About author

Offline


Add a comment
Comments
0 comments on the analysis NZD/USD - Daily