FTSE 100 - FTSE 100 is Testing the Ascending Trend Line - 10/17/2016 (GMT)
- Who voted?
- 1145
- 0
- Timeframe : 4H

FTSE 100 Chart
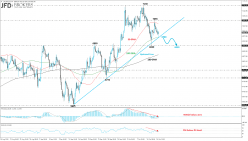
The FTSE 100 index surged more than 11% since June and is recording the fifth green monthly candle in a row. The index is developing above the ascending trend line in the short-term timeframe which is holding over the last month.
Technically, the price is moving slightly above the uptrend line which coincides with the 100-SMA on the 4-hour chart. A break below the latter obstacles will open the door for the 6930 support level and lower to the 200-SMA on the 4-hour chart. On the other side, a rebound on the aforementioned obstacles will expose the price back to the 7055 resistance level. Technical indicators are following a negative territory with some weak momentum. In addition, the MACD oscillator is flattening below its zero line and is in progress to cross its trigger line to the downside. The RSI indicator is falling and is still moving below the 50 level.
Technically, the price is moving slightly above the uptrend line which coincides with the 100-SMA on the 4-hour chart. A break below the latter obstacles will open the door for the 6930 support level and lower to the 200-SMA on the 4-hour chart. On the other side, a rebound on the aforementioned obstacles will expose the price back to the 7055 resistance level. Technical indicators are following a negative territory with some weak momentum. In addition, the MACD oscillator is flattening below its zero line and is in progress to cross its trigger line to the downside. The RSI indicator is falling and is still moving below the 50 level.
This member did not declare if he had a position on this financial instrument or a related financial instrument.
About author

Offline


Add a comment
Comments
0 comments on the analysis FTSE 100 - 4H