S&P500 INDEX - S&P 500 Close At All-Time Highs - 07/21/2016 (GMT)
- Who voted?
- 875
- 0
- Timeframe : Daily
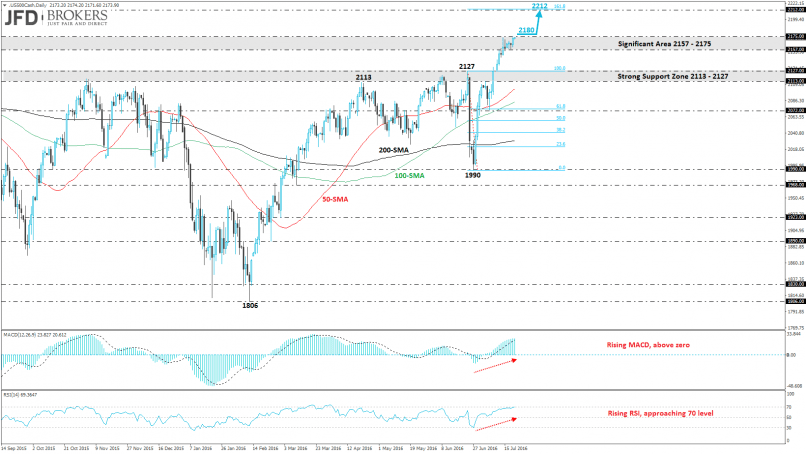
S&P500 INDEX Chart
Are you looking for opportunities in indices and forex?
DISCOVER LONDINIA OPPORTUNITIES...
DISCOVER LONDINIA OPPORTUNITIES...
The S&P 500 index rose for a fourth consecutive week and surged more than 6.6% the last month. This aggressive rally started from the 1990 strong support level and move up to new all-time high at 2175. From a technical point of view, the upward move will continue if the price surpasses above the fresh high and will expose until the 2212 price level which is the 161.8% Fibonacci extension level of the last downward move from the daily chart ( June 23 to June 27). The MACD oscillator is rising and is moving in a bullish territory as the RSI indicator which is in progress to enter the overbought area.
This member did not declare if he had a position on this financial instrument or a related financial instrument.
About author

Offline


Add a comment
Comments
0 comments on the analysis S&P500 INDEX - Daily