S&P500 INDEX - S&P 500 Rose More Than 2% - 11/08/2016 (GMT)
- Who voted?
- 786
- 0
- Timeframe : 4H
S&P500 INDEX Chart
Are you looking for opportunities in indices and forex?
DISCOVER LONDINIA OPPORTUNITIES...
DISCOVER LONDINIA OPPORTUNITIES...
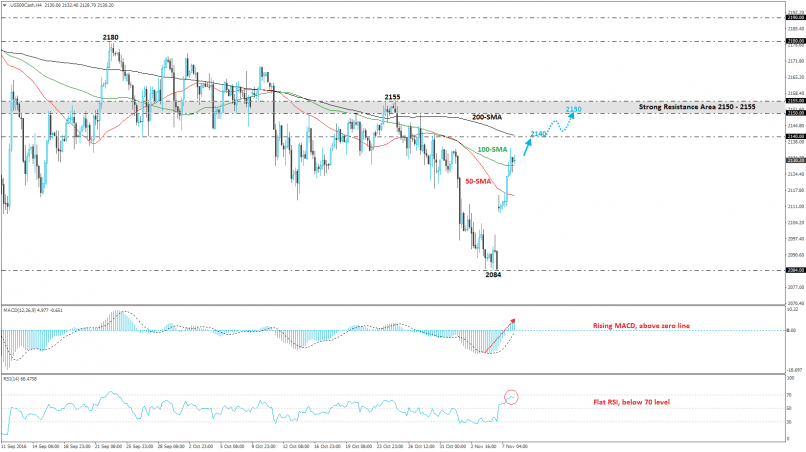
The S&P 500 surged more than 2.2% in this week and posted its biggest rally to the upside over the last couple of months. Stocks gapped higher at the Asian open and continued to trade strongly through the session after its longest sell-off in more than 10 months.
From a technical point of view, the stock index surpassed the 200-daily SMA and is approaching the other two SMAs which are near the 2150 - 2155 resistance zone. The price needs to go through the 200-SMA on the short-term timeframe which coincides with the 2140 resistance barrier. In addition, technical indicators, on the 4-hour chart, are biased higher after entering the positive territory. The MACD oscillator is moving above both, its zero and trigger lines suggesting a stronger index in the next few days. The Relative Strength Index (RSI) is following an upward path above 50, confirming the recent bullish attitude of the price while it is flattening slightly below the overbought area
From a technical point of view, the stock index surpassed the 200-daily SMA and is approaching the other two SMAs which are near the 2150 - 2155 resistance zone. The price needs to go through the 200-SMA on the short-term timeframe which coincides with the 2140 resistance barrier. In addition, technical indicators, on the 4-hour chart, are biased higher after entering the positive territory. The MACD oscillator is moving above both, its zero and trigger lines suggesting a stronger index in the next few days. The Relative Strength Index (RSI) is following an upward path above 50, confirming the recent bullish attitude of the price while it is flattening slightly below the overbought area
This member did not declare if he had a position on this financial instrument or a related financial instrument.
About author

Offline


Add a comment
Comments
0 comments on the analysis S&P500 INDEX - 4H