DJIA VIX - DJIA at an All-time High Near 18,890! - 11/11/2016 (GMT)
- Who voted?
- 720
- 0
- Timeframe : 4H
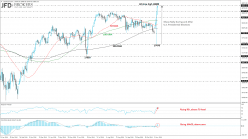
DJIA VIX Chart
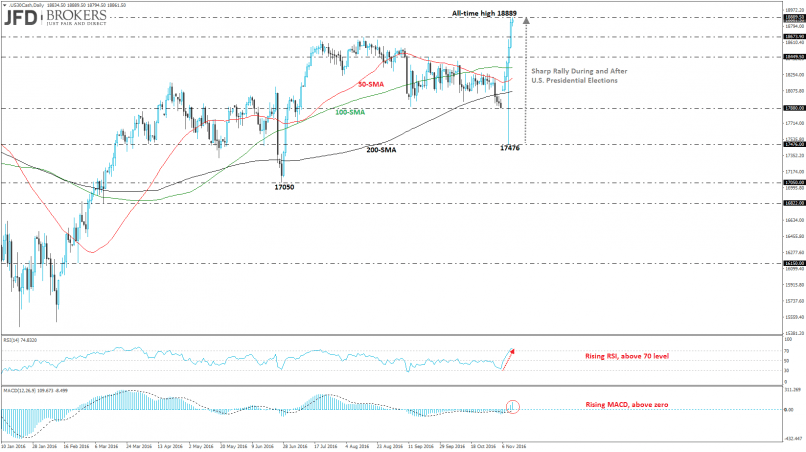
The Dow Jones Industrial Average had an aggressive roller coaster move after the announcement of Trump’s winning in the U.S. Presidential elections. The index surged to an all-time high at 18,889.50 following the strong bounce off the 17,476 support level which was hit early on Wednesday during the U.S. elections. The Dow rose more than 3% over this week and recorded the fifth positive day in a row.
Technically, the index is developing well above the three SMAs (50-SMA, 100-SMA and 200-SMA) on the daily chart, while the technical indicators are endorsing the bullish bias on the price. The RSI indicator is moving in an overbought area with strong momentum after the rebound in the negative area. Furthermore, the MACD oscillator holds in an upward path above both its trigger and zero lines.
Technically, the index is developing well above the three SMAs (50-SMA, 100-SMA and 200-SMA) on the daily chart, while the technical indicators are endorsing the bullish bias on the price. The RSI indicator is moving in an overbought area with strong momentum after the rebound in the negative area. Furthermore, the MACD oscillator holds in an upward path above both its trigger and zero lines.
This member did not declare if he had a position on this financial instrument or a related financial instrument.
About author

Offline


Add a comment
Comments
0 comments on the analysis DJIA VIX - 4H