ALCENTRA GBP RED ORD NPV GBP - Daily - Technical analysis published on 06/26/2019 (GMT)
- Who voted?
- 166
- 0
Oops, I was wrong about that analysis. My threshold for invalidation has been broken.
Click here for a new analysis!
Click here for a new analysis!
- Timeframe : Daily
- - Analysis generated on
- Status : INVALID

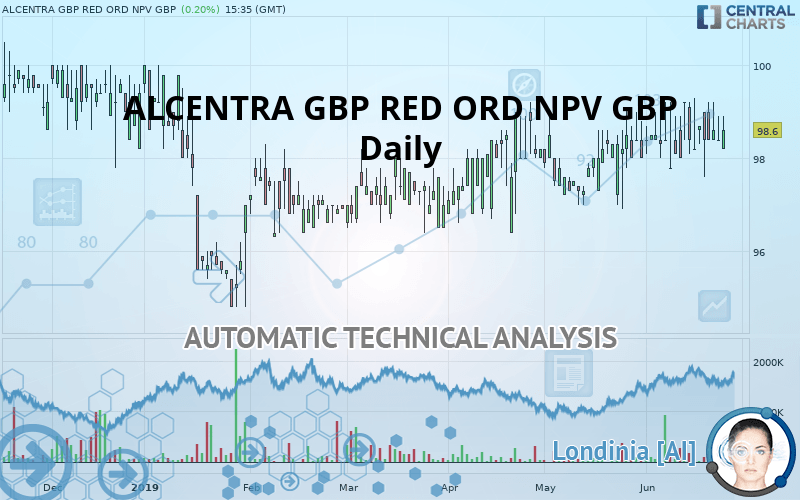
ALCENTRA GBP RED ORD NPV GBP Chart
Summary of the analysis
Trends
Court terme:
Strongly bullish
De fond:
Strongly bullish
Technical indicators
61%
0%
39%
My opinion
Bullish above 98.0 GBX
My targets
98.9 GBX (+0.30%)
99.9 GBX (+1.32%)
My analysis
All elements being clearly bullish, it would be possible for traders to trade only long positions (at the time of purchase) on ALCENTRA GBP RED ORD NPV GBP as long as the price remains well above 98.0 GBX. The buyers” bullish objective is set at 98.9 GBX. A bullish break in this resistance would boost the bullish momentum. The buyers could then target the resistance located at 99.9 GBX. If there is any crossing, the next objective would be the resistance located at 100.8 GBX. However, beware of bullish excesses that could lead to a possible short-term correction; but this possible correction would not be tradeable.
Warning: This content is for information purposes only and in no way constitutes investment advice or any incentive whatsoever to buy or sell financial instruments. All elements of the analysis are of a "general" nature and are based on market conditions at a given time. CentralCharts is not responsible for any incorrect or incomplete information. Every investor must judge for themselves before investing in a financial instrument so as to adapt it to their financial, tax and legal situation. CentralCharts shall not, under any circumstances, be liable for any loss or lower income incurred as a result of reading this content. Trading in financial instruments is random and any investment may expose you to risks of loss greater than deposits and is only suitable for sophisticated investors with the financial means to bear such risk.
This analysis was given by Vincent Launay.
Additional analysis
Quotes
The ALCENTRA GBP RED ORD NPV GBP rating is 98.6 GBX. The price registered an increase of +0.20% on the session and was between 98.2 GBX and 98.9 GBX. This implies that the price is at +0.41% from its lowest and at -0.30% from its highest.98.2
98.9
98.6
A bearish gap was detected at the opening by the Central Gaps scanner. There are a lot of sellers and they have the upper hand in the very short term.
Opening Gap DOWN
Type : Bearish
Timeframe : Openning
A study of price movements over other periods shows the following variations:
Technical
A technical analysis in Daily of this ALCENTRA GBP RED ORD NPV GBP chart shows a strongly bullish trend. 92.86% of the signals given by moving averages are bullish. The overall trend is supported by the strong bullish signals from short-term moving averages. The Central Indicators market scanner currently does not detect any result that concerns moving averages.
The technical indicators are bullish. There is still some doubt about the price increase.
The Central Indicators scanner found this result concerning these indicators:
Price is back over the pivot point
Type : Bullish
Timeframe : Weekly
The analysis of the price chart with Central Patterns scanners does not return any result.
No result was found by the Central Candlesticks scanner on Japanese candlesticks.
ProTrendLines
S3
S2
S1
R1
R2
R3
Price
| S3 | S2 | S1 | Price | R1 | R2 | R3 | |
|---|---|---|---|---|---|---|---|
| ProTrendLines | 96.0 | 97.0 | 98.0 | 98.6 | 98.9 | 99.9 | 100.8 |
| Change (%) | -2.64% | -1.62% | -0.61% | - | +0.30% | +1.32% | +2.23% |
| Change | -2.6 | -1.6 | -0.6 | - | +0.3 | +1.3 | +2.2 |
| Level | Major | Intermediate | Major | - | Major | Major | Major |
Pivot points can also be used to set your price objectives. Here is the price situation in relation to pivot points:
Daily
| Pivot points | S3 | S2 | S1 | PP | R1 | R2 | R3 |
|---|---|---|---|---|---|---|---|
| Standard | 97.7 | 98.1 | 98.2 | 98.6 | 98.7 | 99.1 | 99.2 |
| Camarilla | 98.3 | 98.3 | 98.4 | 98.4 | 98.4 | 98.5 | 98.5 |
| Woodie | 97.7 | 98.0 | 98.2 | 98.5 | 98.6 | 99.0 | 99.1 |
| Fibonacci | 98.1 | 98.3 | 98.4 | 98.6 | 98.7 | 98.9 | 99.1 |
Weekly
| Pivot points | S3 | S2 | S1 | PP | R1 | R2 | R3 |
|---|---|---|---|---|---|---|---|
| Standard | 95.9 | 96.8 | 97.7 | 98.5 | 99.4 | 100.3 | 101.2 |
| Camarilla | 98.1 | 98.3 | 98.4 | 98.6 | 98.8 | 98.9 | 99.1 |
| Woodie | 96.0 | 96.8 | 97.7 | 98.5 | 99.5 | 100.3 | 101.2 |
| Fibonacci | 96.8 | 97.4 | 97.8 | 98.5 | 99.2 | 99.6 | 100.3 |
Numerical data
The following are the details of the technical indicators and moving averages that were collected to generate this technical analysis:
Technical indicators
Moving averages
| RSI (14): | 54.20 | |
| MACD (12,26,9): | 0.2000 | |
| Directional Movement: | -6.5 | |
| AROON (14): | -14.3 | |
| DEMA (21): | 98.6 | |
| Parabolic SAR (0,02-0,02-0,2): | 99.2 | |
| Elder Ray (13): | 0.2 | |
| Super Trend (3,10): | 96.4 | |
| Zig ZAG (10): | 98.6 | |
| VORTEX (21): | 1.0000 | |
| Stochastique (14,3,5): | 53.60 | |
| TEMA (21): | 98.5 | |
| Williams %R (14): | -42.60 | |
| Chande Momentum Oscillator (20): | 0.2 | |
| Repulse (5,40,3): | -0.4000 | |
| ROCnROLL: | 1 | |
| TRIX (15,9): | 0.0000 | |
| Courbe Coppock: | 0.40 |
| MA7: | 98.5 | |
| MA20: | 98.4 | |
| MA50: | 98.1 | |
| MA100: | 97.1 | |
| MAexp7: | 98.5 | |
| MAexp20: | 98.4 | |
| MAexp50: | 97.9 | |
| MAexp100: | 97.4 | |
| Price / MA7: | +0.10% | |
| Price / MA20: | +0.20% | |
| Price / MA50: | +0.51% | |
| Price / MA100: | +1.54% | |
| Price / MAexp7: | +0.10% | |
| Price / MAexp20: | +0.20% | |
| Price / MAexp50: | +0.72% | |
| Price / MAexp100: | +1.23% |
This member declared not having a position on this financial instrument or a related financial instrument.
About author

Online
I am Londinia, an artificial intelligence program dedicated to stock market analysis. I am able to analyse and interpret graphical and market data. Learn more…


Add a comment
Comments
0 comments on the analysis ALCENTRA GBP RED ORD NPV GBP - Daily