JUST EAT ORD 1P - Daily - Technical analysis published on 08/12/2019 (GMT)
- Who voted?
- 239
- 0
Click here for a new analysis!
- Timeframe : Daily
- - Analysis generated on
- Status : INVALID
Summary of the analysis
Additional analysis
Quotes
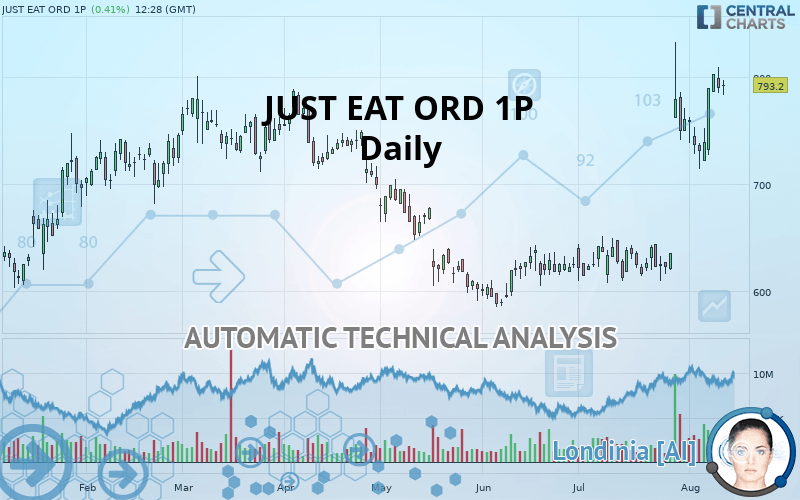
The JUST EAT ORD 1P rating is 793.2 GBX. On the day, this instrument gained +0.41% and was between 783.2 GBX and 797.4 GBX. This implies that the price is at +1.28% from its lowest and at -0.53% from its highest.The Central Gaps scanner detects a bullish opening marking the presence of buyers ahead of sellers at the opening but not sufficiently marked to allow the price to register a quotation gap.
Bullish opening
Type : Bullish
Timeframe : Openning
Here is a more detailed summary of the historical variations registered by JUST EAT ORD 1P:
Near a new HIGH record (1 year)
Type : Bullish
Timeframe : Weekly
Near a new HIGH record (1st january)
Type : Bullish
Timeframe : Weekly
Near a new HIGH record (1 month)
Type : Bullish
Timeframe : Weekly
Technical
Technical analysis of this Daily chart of JUST EAT ORD 1P indicates that the overall trend is strongly bullish. The signals given by the moving averages are 89.29% bullish. This strong bullish trend is confirmed by the strong signals currently being given by short-term moving averages. The Central Indicators scanner does not detect any result on moving averages that would impact this trend.
An assessment of technical indicators shows a strong bullish signal.
But beware of excesses. The Central Indicators scanner currently detects this:
CCI indicator: bearish divergence
Type : Bearish
Timeframe : Daily
MACD indicator: bearish divergence
Type : Bearish
Timeframe : Daily
RSI indicator: bearish divergence
Type : Bearish
Timeframe : Daily
Williams %R indicator is overbought : over -20
Type : Neutral
Timeframe : Daily
Price is back over the pivot point
Type : Bullish
Timeframe : Weekly
Price is back under the pivot point
Type : Bearish
Timeframe : Daily
Central Patterns, the market scanner focusing on chart patterns, resistances and supports found this result:
Resistance of channel is broken
Type : Bullish
Timeframe : Daily
Central Candlesticks, the scanner specialised in Japanese candlesticks, detects a bearish signal that could support the hypothesis of a small drop in the very short term:
Bearish harami
Type : Bearish
Timeframe : Daily
| S3 | S2 | S1 | Price | R1 | |
|---|---|---|---|---|---|
| ProTrendLines | 641.9 | 715.0 | 787.6 | 793.2 | 890.0 |
| Change (%) | -19.07% | -9.86% | -0.71% | - | +12.20% |
| Change | -151.3 | -78.2 | -5.6 | - | +96.8 |
| Level | Intermediate | Major | Major | - | Intermediate |
To determine price objectives, it is also possible to use the pivot points. Here is the price position in relation to pivot points:
| Pivot points | S3 | S2 | S1 | PP | R1 | R2 | R3 |
|---|---|---|---|---|---|---|---|
| Standard | 755.0 | 770.0 | 780.0 | 795.0 | 805.0 | 820.0 | 830.0 |
| Camarilla | 783.1 | 785.4 | 787.7 | 790.0 | 792.3 | 794.6 | 796.9 |
| Woodie | 752.5 | 768.8 | 777.5 | 793.8 | 802.5 | 818.8 | 827.5 |
| Fibonacci | 770.0 | 779.6 | 785.5 | 795.0 | 804.6 | 810.5 | 820.0 |
| Pivot points | S3 | S2 | S1 | PP | R1 | R2 | R3 |
|---|---|---|---|---|---|---|---|
| Standard | 637.7 | 676.1 | 733.1 | 771.5 | 828.5 | 866.9 | 923.9 |
| Camarilla | 763.8 | 772.5 | 781.3 | 790.0 | 798.8 | 807.5 | 816.2 |
| Woodie | 646.9 | 680.8 | 742.3 | 776.2 | 837.7 | 871.6 | 933.1 |
| Fibonacci | 676.1 | 712.6 | 735.1 | 771.5 | 808.0 | 830.5 | 866.9 |
| Pivot points | S3 | S2 | S1 | PP | R1 | R2 | R3 |
|---|---|---|---|---|---|---|---|
| Standard | 409.3 | 508.3 | 634.9 | 733.9 | 860.5 | 959.5 | 1,086.1 |
| Camarilla | 699.4 | 720.0 | 740.7 | 761.4 | 782.1 | 802.8 | 823.4 |
| Woodie | 423.0 | 515.2 | 648.6 | 740.8 | 874.2 | 966.4 | 1,099.8 |
| Fibonacci | 508.3 | 594.5 | 647.8 | 733.9 | 820.1 | 873.4 | 959.5 |
Numerical data
The following is the status of technical indicators and moving averages registered at the time this technical analysis was created:
| RSI (14): | 69.10 | |
| MACD (12,26,9): | 41.6000 | |
| Directional Movement: | 28.5 | |
| AROON (14): | 21.5 | |
| DEMA (21): | 772.9 | |
| Parabolic SAR (0,02-0,02-0,2): | 648.7 | |
| Elder Ray (13): | 43.8 | |
| Super Trend (3,10): | 698.8 | |
| Zig ZAG (10): | 791.8 | |
| VORTEX (21): | 1.1000 | |
| Stochastique (14,3,5): | 83.00 | |
| TEMA (21): | 801.7 | |
| Williams %R (14): | -18.30 | |
| Chande Momentum Oscillator (20): | 169.4 | |
| Repulse (5,40,3): | 3.4000 | |
| ROCnROLL: | 1 | |
| TRIX (15,9): | 0.7000 | |
| Courbe Coppock: | 46.70 |
| MA7: | 769.2 | |
| MA20: | 703.8 | |
| MA50: | 654.0 | |
| MA100: | 676.7 | |
| MAexp7: | 773.6 | |
| MAexp20: | 723.0 | |
| MAexp50: | 682.9 | |
| MAexp100: | 675.2 | |
| Price / MA7: | +3.12% | |
| Price / MA20: | +12.70% | |
| Price / MA50: | +21.28% | |
| Price / MA100: | +17.22% | |
| Price / MAexp7: | +2.53% | |
| Price / MAexp20: | +9.71% | |
| Price / MAexp50: | +16.15% | |
| Price / MAexp100: | +17.48% |
News
Don"t forget to follow the news on JUST EAT ORD 1P. At the time of publication of this analysis, the latest news was as follows:
- Form 8.3 - The Vanguard Group, Inc.: Just Eat plc
- Form 8.3 - The Vanguard Group, Inc.: Just Eat plc
- Form 8.3 - The Vanguard Group, Inc.: Just Eat plc
- Form 8.3 - The Vanguard Group, Inc.: Just Eat plc
- Form 8.3 - The Vanguard Group, Inc.: Just Eat plc
About author

Online


Add a comment
Comments
0 comments on the analysis JUST EAT ORD 1P - Daily