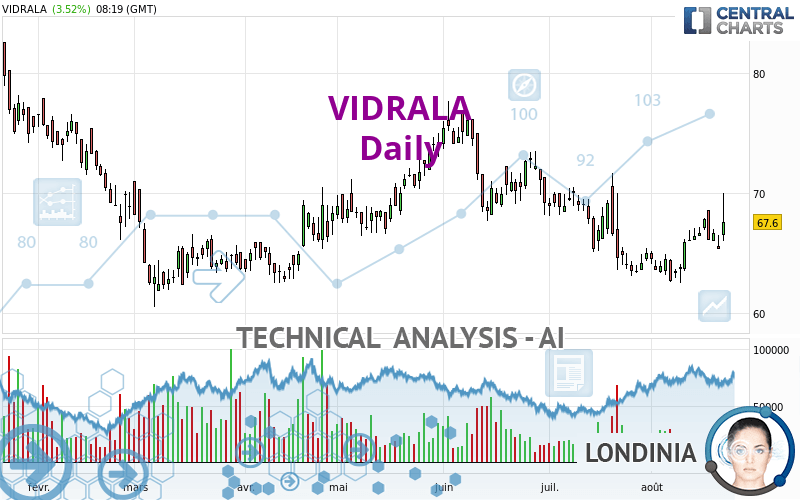
VIDRALA - Daily - Technical analysis published on 08/22/2022 (GMT)
- 168
- 0
Click here for a new analysis!
- Timeframe : Daily
- - Analysis generated on
- Status : INVALID

Summary of the analysis

Additional analysis
Quotes
VIDRALA rating 67.6 EUR. On the day, this instrument gained +3.52% and was traded between 66.0 EUR and 70.0 EUR over the period. The price is currently at +2.42% from its lowest and -3.43% from its highest.The Central Gaps scanner detects a bullish opening. A small advantage for buyers in the very short term.
Bullish opening
Type : Bullish
Timeframe : Openning
A study of price movements over other periods shows the following variations:
New HIGH record (1 month)
Type : Bullish
Timeframe : Weekly
Technical
Technical analysis of this Daily chart of VIDRALA indicates that the overall trend is not clearly defined. This indecision could turn into a bullish trend due to the strong bullish signals currently being given by short-term moving averages. The Central Indicators market scanner is currently detecting several bullish signals that could impact this trend:
Bullish price crossover with Moving Average 50
Type : Bullish
Timeframe : Daily
Bullish price crossover with Moving Average 100
Type : Bullish
Timeframe : Daily
Bullish price crossover with adaptative moving average 20
Type : Bullish
Timeframe : Daily
Bullish price crossover with adaptative moving average 50
Type : Bullish
Timeframe : Daily
Bullish price crossover with adaptative moving average 100
Type : Bullish
Timeframe : Daily
In fact, according to the parameters integrated into the Central Analyzer system, 13 technical indicators out of 18 analysed are currently bullish. Caution: the Central Indicators scanner currently detects an excess:
CCI indicator is overbought : over 100
Type : Neutral
Timeframe : Daily
Pivot points : price is over resistance 1
Type : Neutral
Timeframe : Weekly
Pivot points : price is over resistance 3
Type : Neutral
Timeframe : Daily
RSI indicator is back over 50
Type : Bullish
Timeframe : Daily
MACD indicator is back over 0
Type : Bullish
Timeframe : Daily
Williams %R indicator is back over -50
Type : Bullish
Timeframe : Daily
The Central Patterns scanner, which studies chart patterns, resistances and supports, has identified these signals:
Near horizontal resistance
Type : Bearish
Timeframe : Daily
Resistance of channel is broken
Type : Bullish
Timeframe : Daily
No result was found by the Central Candlesticks scanner on Japanese candlesticks.
| S3 | S2 | S1 | Price | R1 | R2 | R3 | |
|---|---|---|---|---|---|---|---|
| ProTrendLines | 26.2 | 51.3 | 63.1 | 67.6 | 69.4 | 72.5 | 78.8 |
| Change (%) | -61.24% | -24.11% | -6.66% | - | +2.66% | +7.25% | +16.57% |
| Change | -41.4 | -16.3 | -4.5 | - | +1.8 | +4.9 | +11.2 |
| Level | Minor | Minor | Major | - | Intermediate | Minor | Major |
Attention could also be paid to pivot points to set price objectives:
| Pivot points | S3 | S2 | S1 | PP | R1 | R2 | R3 |
|---|---|---|---|---|---|---|---|
| Standard | 63.7 | 64.5 | 64.9 | 65.7 | 66.1 | 66.9 | 67.3 |
| Camarilla | 65.0 | 65.1 | 65.2 | 65.3 | 65.4 | 65.5 | 65.6 |
| Woodie | 63.5 | 64.4 | 64.7 | 65.6 | 65.9 | 66.8 | 67.1 |
| Fibonacci | 64.5 | 65.0 | 65.2 | 65.7 | 66.2 | 66.4 | 66.9 |
| Pivot points | S3 | S2 | S1 | PP | R1 | R2 | R3 |
|---|---|---|---|---|---|---|---|
| Standard | 60.9 | 63.1 | 64.2 | 66.4 | 67.5 | 69.7 | 70.8 |
| Camarilla | 64.4 | 64.7 | 65.0 | 65.3 | 65.6 | 65.9 | 66.2 |
| Woodie | 60.4 | 62.8 | 63.7 | 66.1 | 67.0 | 69.4 | 70.3 |
| Fibonacci | 63.1 | 64.4 | 65.1 | 66.4 | 67.7 | 68.4 | 69.7 |
| Pivot points | S3 | S2 | S1 | PP | R1 | R2 | R3 |
|---|---|---|---|---|---|---|---|
| Standard | 52.9 | 58.0 | 61.5 | 66.6 | 70.1 | 75.2 | 78.7 |
| Camarilla | 62.6 | 63.4 | 64.2 | 65.0 | 65.8 | 66.6 | 67.4 |
| Woodie | 52.1 | 57.6 | 60.7 | 66.2 | 69.3 | 74.8 | 77.9 |
| Fibonacci | 58.0 | 61.3 | 63.3 | 66.6 | 69.9 | 71.9 | 75.2 |
Numerical data
The following are the details of the technical indicators and moving averages that were collected to generate this technical analysis:
| RSI (14): | 57.40 | |
| MACD (12,26,9): | 0.0000 | |
| Directional Movement: | 15.4 | |
| AROON (14): | 64.3 | |
| DEMA (21): | 65.7 | |
| Parabolic SAR (0,02-0,02-0,2): | 64.3 | |
| Elder Ray (13): | 1.9 | |
| Super Trend (3,10): | 68.4 | |
| Zig ZAG (10): | 68.2 | |
| VORTEX (21): | 1.0000 | |
| Stochastique (14,3,5): | 63.60 | |
| TEMA (21): | 66.6 | |
| Williams %R (14): | -24.00 | |
| Chande Momentum Oscillator (20): | 3.7 | |
| Repulse (5,40,3): | 0.5000 | |
| ROCnROLL: | 1 | |
| TRIX (15,9): | -0.1000 | |
| Courbe Coppock: | 8.20 |
| MA7: | 66.7 | |
| MA20: | 65.1 | |
| MA50: | 67.3 | |
| MA100: | 67.9 | |
| MAexp7: | 66.6 | |
| MAexp20: | 66.0 | |
| MAexp50: | 66.9 | |
| MAexp100: | 68.4 | |
| Price / MA7: | +1.35% | |
| Price / MA20: | +3.84% | |
| Price / MA50: | +0.45% | |
| Price / MA100: | -0.44% | |
| Price / MAexp7: | +1.50% | |
| Price / MAexp20: | +2.42% | |
| Price / MAexp50: | +1.05% | |
| Price / MAexp100: | -1.17% |
About author
Online


Add a comment
Comments
0 comments on the analysis VIDRALA - Daily