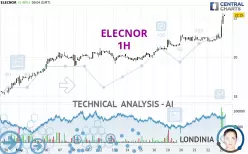
ELECNOR - 1H - Technical analysis published on 05/23/2025 (GMT)
- 85
- 0
- Timeframe : 1H
- - Analysis generated on
- Status : WITHOUT TARGET

Summary of the analysis

Additional analysis
Quotes
The ELECNOR rating is 22.15 EUR. The price has increased by +5.48% since the last closing with the lowest point at 21.00 EUR and the highest point at 22.25 EUR. The deviation from the price is +5.48% for the low point and -0.45% for the high point.So that you have an overall view of the price change, here is a table showing the variations over several periods:
New HIGH record (5 years)
Type : Bullish
Timeframe : Weekly
New HIGH record (1 year)
Type : Bullish
Timeframe : Weekly
New HIGH record (1st january)
Type : Bullish
Timeframe : Weekly
New HIGH record (1 month)
Type : Bullish
Timeframe : Weekly
Technical
Technical analysis of this 1H chart of ELECNOR indicates that the overall trend is strongly bullish. The signals given by the moving averages are 92.86% bullish. This strong bullish trend is confirmed by the strong signals currently being given by short-term moving averages. The Central Indicators scanner does not detect any result on moving averages that would impact this trend.
In fact, 17 technical indicators on 18 studied are currently positioned bullish. Caution: the Central Indicators scanner currently detects an excess:
RSI indicator is overbought : over 80
Type : Neutral
Timeframe : 1 hour
CCI indicator is overbought : over 100
Type : Neutral
Timeframe : 1 hour
Previous candle closed over Bollinger bands
Type : Neutral
Timeframe : 1 hour
Williams %R indicator is overbought : over -20
Type : Neutral
Timeframe : 1 hour
Pivot points : price is over resistance 3 (Daily)
Type : Neutral
Timeframe : 1 hour
Pivot points : price is over resistance 3 (Daily)
Type : Neutral
Timeframe : Weekly
Pivot points : price is over resistance 3 (Weekly)
Type : Neutral
Timeframe : 1 hour
Pivot points : price is over resistance 3 (Monthly)
Type : Neutral
Timeframe : 1 hour
An analysis of the price chart with the Central Patterns scanner (detector of chart patterns and resistances and supports) shows several results that can have an impact on the price change:
Near support of channel
Type : Bullish
Timeframe : 1 hour
Near support of triangle
Type : Bullish
Timeframe : 1 hour
The presence of these bullish Japanese candlestick patterns detected by Central Candlesticks that could cause a very short term rebound were also noted:
White line without lower shadow
Type : Bullish
Timeframe : 1 hour
Long white line
Type : Bullish
Timeframe : 1 hour
| S3 | S2 | S1 | Price | |
|---|---|---|---|---|
| ProTrendLines | 20.25 | 20.80 | 21.13 | 22.15 |
| Change (%) | -8.58% | -6.09% | -4.60% | - |
| Change | -1.90 | -1.35 | -1.02 | - |
| Level | Intermediate | Intermediate | Intermediate | - |
To determine price objectives, it is also possible to use the pivot points. Here is the price position in relation to pivot points:
| Pivot points | S3 | S2 | S1 | PP | R1 | R2 | R3 |
|---|---|---|---|---|---|---|---|
| Standard | 20.40 | 20.60 | 20.80 | 21.00 | 21.20 | 21.40 | 21.60 |
| Camarilla | 20.89 | 20.93 | 20.96 | 21.00 | 21.04 | 21.07 | 21.11 |
| Woodie | 20.40 | 20.60 | 20.80 | 21.00 | 21.20 | 21.40 | 21.60 |
| Fibonacci | 20.60 | 20.75 | 20.85 | 21.00 | 21.15 | 21.25 | 21.40 |
| Pivot points | S3 | S2 | S1 | PP | R1 | R2 | R3 |
|---|---|---|---|---|---|---|---|
| Standard | 19.00 | 19.33 | 19.89 | 20.22 | 20.78 | 21.11 | 21.67 |
| Camarilla | 20.21 | 20.29 | 20.37 | 20.45 | 20.53 | 20.61 | 20.70 |
| Woodie | 19.12 | 19.39 | 20.01 | 20.28 | 20.90 | 21.17 | 21.79 |
| Fibonacci | 19.33 | 19.67 | 19.88 | 20.22 | 20.56 | 20.77 | 21.11 |
| Pivot points | S3 | S2 | S1 | PP | R1 | R2 | R3 |
|---|---|---|---|---|---|---|---|
| Standard | 12.44 | 13.76 | 16.32 | 17.64 | 20.20 | 21.52 | 24.08 |
| Camarilla | 17.81 | 18.17 | 18.52 | 18.88 | 19.24 | 19.59 | 19.95 |
| Woodie | 13.06 | 14.07 | 16.94 | 17.95 | 20.82 | 21.83 | 24.70 |
| Fibonacci | 13.76 | 15.24 | 16.16 | 17.64 | 19.12 | 20.04 | 21.52 |
Numerical data
The following is the status of the technical indicators and moving averages at the time of publication of this technical analysis:
| RSI (14): | 81.96 | |
| MACD (12,26,9): | 0.2000 | |
| Directional Movement: | 46.42 | |
| AROON (14): | 71.43 | |
| DEMA (21): | 21.32 | |
| Parabolic SAR (0,02-0,02-0,2): | 20.90 | |
| Elder Ray (13): | 0.78 | |
| Super Trend (3,10): | 21.21 | |
| Zig ZAG (10): | 22.20 | |
| VORTEX (21): | 1.1400 | |
| Stochastique (14,3,5): | 71.58 | |
| TEMA (21): | 21.40 | |
| Williams %R (14): | -3.45 | |
| Chande Momentum Oscillator (20): | 1.25 | |
| Repulse (5,40,3): | 4.5400 | |
| ROCnROLL: | 1 | |
| TRIX (15,9): | 0.0700 | |
| Courbe Coppock: | 3.28 |
| MA7: | 20.93 | |
| MA20: | 19.92 | |
| MA50: | 18.30 | |
| MA100: | 17.51 | |
| MAexp7: | 21.40 | |
| MAexp20: | 21.09 | |
| MAexp50: | 20.80 | |
| MAexp100: | 20.38 | |
| Price / MA7: | +5.83% | |
| Price / MA20: | +11.19% | |
| Price / MA50: | +21.04% | |
| Price / MA100: | +26.50% | |
| Price / MAexp7: | +3.50% | |
| Price / MAexp20: | +5.03% | |
| Price / MAexp50: | +6.49% | |
| Price / MAexp100: | +8.68% |
News
The last news published on ELECNOR at the time of the generation of this analysis was as follows:
- Fusion Fuel Green and Elecnor Group Establish Partnership to Develop Green Hydrogen Generation Projects in Spain
- SpaceChain Partners Elecnor DEIMOS to Develop Blockchain-enabled Credit Management and Payment Service for the European Space Agency-funded ECOMI Project
- SpaceChain Partners Elecnor DEIMOS to Develop Blockchain-enabled Credit Management and Payment Service for the European Space Agency-funded ECOMI Project
-
 Elecnor
About author
Online


Add a comment
Comments
0 comments on the analysis ELECNOR - 1H