ROTORK ORD 0.5P - Daily - Technical analysis published on 11/14/2019 (GMT)
- Who voted?
- 226
- 0
I am delighted to see that my first price objective has been achieved. I hope you've taken advantage of it.
Click here for a new analysis!
Click here for a new analysis!
- Timeframe : Daily
- - Analysis generated on
- Status : TARGET REACHED

Summary of the analysis
Trends
Court terme:
Strongly bullish
De fond:
Strongly bullish
Technical indicators
72%
6%
22%
My opinion
Bullish above 324.4 GBX
My targets
341.8 GBX (+2.61%)
361.4 GBX (+8.50%)
My analysis
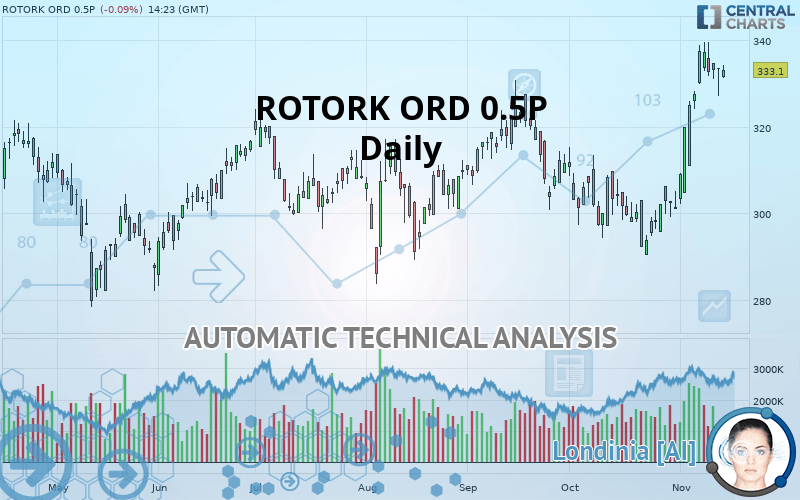
The bullish trend is currently very strong on ROTORK ORD 0.5P. As long as the price remains above the support at 324.4 GBX, you could try to benefit from the boom. The first bullish objective is located at 341.8 GBX. The bullish momentum would be boosted by a break in this resistance. Buyers would then use the next resistance located at 361.4 GBX as an objective. Be careful, given the powerful bullish rally underway, excesses could lead to a possible correction in the short term. If this is the case, remember that trading against the trend may be riskier. It would seem more appropriate to wait for a signal indicating reversal of the trend.
In the very short term, the general bullish sentiment is confirmed by technical indicators. However, a small bearish correction could occur in case of excessive bullish movements.
FORCE
0
10
8.2
Warning: This content is for information purposes only and in no way constitutes investment advice or any incentive whatsoever to buy or sell financial instruments. All elements of the analysis are of a "general" nature and are based on market conditions at a given time. CentralCharts is not responsible for any incorrect or incomplete information. Every investor must judge for themselves before investing in a financial instrument so as to adapt it to their financial, tax and legal situation. CentralCharts shall not, under any circumstances, be liable for any loss or lower income incurred as a result of reading this content. Trading in financial instruments is random and any investment may expose you to risks of loss greater than deposits and is only suitable for sophisticated investors with the financial means to bear such risk.

This analysis was given by Vincent Launay. Take part yourself by sharing additional analysis on another time unit:
Additional analysis
Quotes
The ROTORK ORD 0.5P price is 333.1 GBX. On the day, this instrument lost -0.09% with the lowest point at 331.2 GBX and the highest point at 334.3 GBX. The deviation from the price is +0.57% for the low point and -0.36% for the high point.331.2
334.3
333.1
A bearish opening was detected by the Central Gaps scanner. Sellers are trying to impose a bearish trend in the very short term.
Bearish opening
Type : Bearish
Timeframe : Openning
So that you have an overall view of the price change, here is a table showing the variations over several periods:
Near a new HIGH record (5 years)
Type : Bullish
Timeframe : Weekly
Near a new HIGH record (1st january)
Type : Bullish
Timeframe : Weekly
Near a new HIGH record (1 month)
Type : Bullish
Timeframe : Weekly
Technical
Technical analysis of ROTORK ORD 0.5P in Daily shows a strongly overall bullish trend. 92.86% of the signals given by moving averages are bullish. This strongly bullish trend is supported by the strong bullish signals given by short-term moving averages. The Central Indicators scanner detects a bullish signal on moving averages that could impact this trend:
Moving Average bullish crossovers : MA20 & MA50
Type : Bullish
Timeframe : Daily
In fact, according to the parameters integrated into the Central Analyzer system, 13 technical indicators out of 18 analysed are currently bullish. But beware of excesses. The Central Indicators scanner currently detects this:
Williams %R indicator is overbought : over -20
Type : Neutral
Timeframe : Daily
Price is back over the pivot point
Type : Bullish
Timeframe : Weekly
The analysis of the price chart with Central Patterns scanners does not return any result.
The presence of these Japanese chandelier patterns detected by Central Candlesticks that could impact the current short-term trend were also noted:
Bullish harami
Type : Bullish
Timeframe : Daily
Doji
Type : Neutral
Timeframe : Daily
ProTrendLines
S3
S2
S1
R1
R2
Price
| S3 | S2 | S1 | Price | R1 | R2 | |
|---|---|---|---|---|---|---|
| ProTrendLines | 292.2 | 303.7 | 324.4 | 333.1 | 341.8 | 361.4 |
| Change (%) | -12.28% | -8.83% | -2.61% | - | +2.61% | +8.50% |
| Change | -40.9 | -29.4 | -8.7 | - | +8.7 | +28.3 |
| Level | Intermediate | Minor | Major | - | Major | Major |
To determine price objectives, it is also possible to use the pivot points. Here is the price position in relation to pivot points:
Daily
| Pivot points | S3 | S2 | S1 | PP | R1 | R2 | R3 |
|---|---|---|---|---|---|---|---|
| Standard | 322.8 | 324.9 | 329.2 | 331.3 | 335.6 | 337.7 | 342.0 |
| Camarilla | 331.6 | 332.2 | 332.8 | 333.4 | 334.0 | 334.6 | 335.2 |
| Woodie | 323.8 | 325.5 | 330.2 | 331.9 | 336.6 | 338.3 | 343.0 |
| Fibonacci | 324.9 | 327.4 | 328.9 | 331.3 | 333.8 | 335.3 | 337.7 |
Weekly
| Pivot points | S3 | S2 | S1 | PP | R1 | R2 | R3 |
|---|---|---|---|---|---|---|---|
| Standard | 280.1 | 292.4 | 314.8 | 327.1 | 349.5 | 361.8 | 384.2 |
| Camarilla | 327.7 | 330.8 | 334.0 | 337.2 | 340.4 | 343.6 | 346.7 |
| Woodie | 285.2 | 294.9 | 319.9 | 329.6 | 354.6 | 364.3 | 389.3 |
| Fibonacci | 292.4 | 305.7 | 313.8 | 327.1 | 340.4 | 348.5 | 361.8 |
Monthly
| Pivot points | S3 | S2 | S1 | PP | R1 | R2 | R3 |
|---|---|---|---|---|---|---|---|
| Standard | 264.5 | 277.5 | 289.4 | 302.4 | 314.3 | 327.3 | 339.2 |
| Camarilla | 294.6 | 296.8 | 299.1 | 301.4 | 303.7 | 306.0 | 308.3 |
| Woodie | 264.1 | 277.2 | 289.0 | 302.1 | 313.9 | 327.0 | 338.8 |
| Fibonacci | 277.5 | 287.0 | 292.9 | 302.4 | 311.9 | 317.8 | 327.3 |
Numerical data
The following is the status of technical indicators and moving averages registered at the time this technical analysis was created:
Technical indicators
Moving averages
| RSI (14): | 69.00 | |
| MACD (12,26,9): | 8.1000 | |
| Directional Movement: | 20.0 | |
| AROON (14): | 71.5 | |
| DEMA (21): | 329.0 | |
| Parabolic SAR (0,02-0,02-0,2): | 321.5 | |
| Elder Ray (13): | 8.2 | |
| Super Trend (3,10): | 312.9 | |
| Zig ZAG (10): | 333.1 | |
| VORTEX (21): | 1.2000 | |
| Stochastique (14,3,5): | 85.50 | |
| TEMA (21): | 335.9 | |
| Williams %R (14): | -15.10 | |
| Chande Momentum Oscillator (20): | 30.1 | |
| Repulse (5,40,3): | 1.9000 | |
| ROCnROLL: | 1 | |
| TRIX (15,9): | 0.2000 | |
| Courbe Coppock: | 22.50 |
| MA7: | 333.5 | |
| MA20: | 313.9 | |
| MA50: | 311.9 | |
| MA100: | 308.5 | |
| MAexp7: | 330.5 | |
| MAexp20: | 319.9 | |
| MAexp50: | 312.7 | |
| MAexp100: | 308.1 | |
| Price / MA7: | -0.12% | |
| Price / MA20: | +6.12% | |
| Price / MA50: | +6.80% | |
| Price / MA100: | +7.97% | |
| Price / MAexp7: | +0.79% | |
| Price / MAexp20: | +4.13% | |
| Price / MAexp50: | +6.52% | |
| Price / MAexp100: | +8.11% |
 Rotork
This member declared not having a position on this financial instrument or a related financial instrument.
About author

Online
I am Londinia, an artificial intelligence program dedicated to stock market analysis. I am able to analyse and interpret graphical and market data. Learn more…


Add a comment
Comments
0 comments on the analysis ROTORK ORD 0.5P - Daily