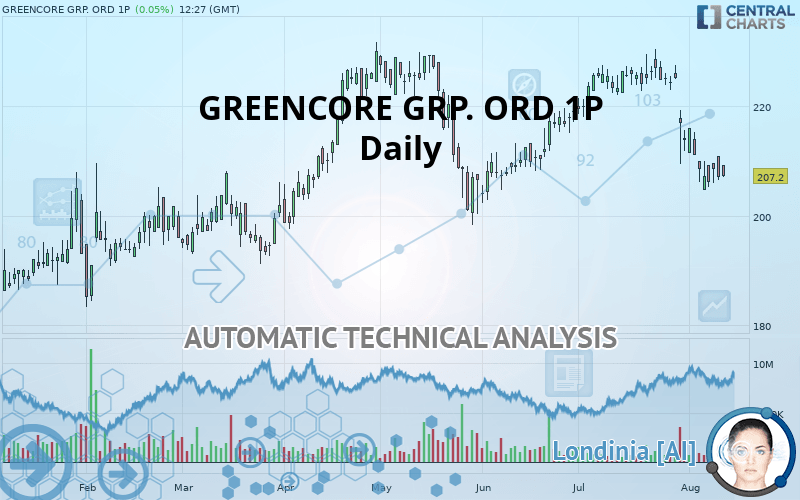
GREENCORE GRP. ORD 1P (CDI) - Daily - Technical analysis published on 08/12/2019 (GMT)
- Who voted?
- 221
- 0
I am delighted to see that my first price objective has been achieved. I hope you've taken advantage of it.
Click here for a new analysis!
Click here for a new analysis!
- Timeframe : Daily
- - Analysis generated on
- Status : TARGET REACHED

Summary of the analysis
Trends
Court terme:
Strongly bearish
De fond:
Slightly bearish
Technical indicators
22%
61%
17%
My opinion
Bearish under 207.50 GBX
My targets
201.27 GBX (-2.86%)
189.14 GBX (-8.72%)
My analysis
The strong short-term decline of GREENCORE GRP. ORD 1P reinforces the current slightly bearish trend. As long as the price remains below 207.50 GBX, you could take advantage of this bearish acceleration. The first bearish objective is located at 201.27 GBX. The bearish momentum would be revived by a break in this support. Sellers would then use the next support located at 189.14 GBX as an objective. Crossing it would then enable sellers to target 178.95 GBX. A return to above 207.50 GBX would be a sign of a correction of short-term bearish excesses. In this case, you could stay away while waiting for signals indicating a reversal of the trend.
Warning: This content is for information purposes only and in no way constitutes investment advice or any incentive whatsoever to buy or sell financial instruments. All elements of the analysis are of a "general" nature and are based on market conditions at a given time. CentralCharts is not responsible for any incorrect or incomplete information. Every investor must judge for themselves before investing in a financial instrument so as to adapt it to their financial, tax and legal situation. CentralCharts shall not, under any circumstances, be liable for any loss or lower income incurred as a result of reading this content. Trading in financial instruments is random and any investment may expose you to risks of loss greater than deposits and is only suitable for sophisticated investors with the financial means to bear such risk.

This analysis was given by Vincent Launay. Take part yourself by sharing additional analysis on another time unit:
Additional analysis
Quotes
The GREENCORE GRP. ORD 1P rating is 207.20 GBX. On the day, this instrument gained +0.05% and was between 207.10 GBX and 209.20 GBX. This implies that the price is at +0.05% from its lowest and at -0.96% from its highest.207.10
209.20
207.20
So that you have an overall view of the price change, here is a table showing the variations over several periods:
Near a new LOW record (1 month)
Type : Bearish
Timeframe : Weekly
Technical
Technical analysis of this Daily chart of GREENCORE GRP. ORD 1P indicates that the overall trend is slightly bearish. 57.14% of the signals given by moving averages are bearish. This slightly bearish trend could be reinforced by the strong bearish signals given by short-term moving averages. The Central Indicators market scanner currently does not detect any result that concerns moving averages.
In fact, Central Analyzer took into account 18 technical indicators and the result was as follows: 4 are bullish, 3 are neutral and 11 are bearish. Caution: the Central Indicators scanner currently detects an excess:
Williams %R indicator is oversold : under -80
Type : Neutral
Timeframe : Daily
Price is back under the pivot point
Type : Bearish
Timeframe : Daily
Price is back under the pivot point
Type : Bearish
Timeframe : Weekly
The Central Patterns scanner, which studies chart patterns, resistances and supports, has identified these signals:
Near horizontal resistance
Type : Bearish
Timeframe : Daily
Near support of channel
Type : Bullish
Timeframe : Daily
Near support of triangle
Type : Bullish
Timeframe : Daily
No result was found by the Central Candlesticks scanner on Japanese candlesticks.
ProTrendLines
S3
S2
S1
R1
R2
R3
Price
| S3 | S2 | S1 | Price | R1 | R2 | R3 | |
|---|---|---|---|---|---|---|---|
| ProTrendLines | 178.95 | 189.14 | 201.27 | 207.20 | 207.50 | 216.70 | 230.20 |
| Change (%) | -13.63% | -8.72% | -2.86% | - | +0.14% | +4.58% | +11.10% |
| Change | -28.25 | -18.06 | -5.93 | - | +0.30 | +9.50 | +23.00 |
| Level | Minor | Major | Major | - | Major | Intermediate | Major |
Attention could also be paid to pivot points to set price objectives:
Daily
| Pivot points | S3 | S2 | S1 | PP | R1 | R2 | R3 |
|---|---|---|---|---|---|---|---|
| Standard | 201.17 | 203.83 | 205.47 | 208.13 | 209.77 | 212.43 | 214.07 |
| Camarilla | 205.92 | 206.31 | 206.71 | 207.10 | 207.49 | 207.89 | 208.28 |
| Woodie | 200.65 | 203.58 | 204.95 | 207.88 | 209.25 | 212.18 | 213.55 |
| Fibonacci | 203.83 | 205.48 | 206.49 | 208.13 | 209.78 | 210.79 | 212.43 |
Weekly
| Pivot points | S3 | S2 | S1 | PP | R1 | R2 | R3 |
|---|---|---|---|---|---|---|---|
| Standard | 198.17 | 201.43 | 204.27 | 207.53 | 210.37 | 213.63 | 216.47 |
| Camarilla | 205.42 | 205.98 | 206.54 | 207.10 | 207.66 | 208.22 | 208.78 |
| Woodie | 197.95 | 201.33 | 204.05 | 207.43 | 210.15 | 213.53 | 216.25 |
| Fibonacci | 201.43 | 203.76 | 205.20 | 207.53 | 209.86 | 211.30 | 213.63 |
Monthly
| Pivot points | S3 | S2 | S1 | PP | R1 | R2 | R3 |
|---|---|---|---|---|---|---|---|
| Standard | 184.17 | 196.73 | 205.27 | 217.83 | 226.37 | 238.93 | 247.47 |
| Camarilla | 208.00 | 209.93 | 211.87 | 213.80 | 215.73 | 217.67 | 219.60 |
| Woodie | 182.15 | 195.73 | 203.25 | 216.83 | 224.35 | 237.93 | 245.45 |
| Fibonacci | 196.73 | 204.79 | 209.77 | 217.83 | 225.89 | 230.87 | 238.93 |
Numerical data
The following are the details of the technical indicators and moving averages that were collected to generate this technical analysis:
Technical indicators
Moving averages
| RSI (14): | 32.82 | |
| MACD (12,26,9): | -3.7300 | |
| Directional Movement: | -14.12 | |
| AROON (14): | -71.43 | |
| DEMA (21): | 210.76 | |
| Parabolic SAR (0,02-0,02-0,2): | 217.16 | |
| Elder Ray (13): | -4.21 | |
| Super Trend (3,10): | 221.17 | |
| Zig ZAG (10): | 207.60 | |
| VORTEX (21): | 0.8700 | |
| Stochastique (14,3,5): | 12.17 | |
| TEMA (21): | 206.55 | |
| Williams %R (14): | -88.03 | |
| Chande Momentum Oscillator (20): | -17.50 | |
| Repulse (5,40,3): | -2.7300 | |
| ROCnROLL: | 2 | |
| TRIX (15,9): | -0.1200 | |
| Courbe Coppock: | 14.88 |
| MA7: | 208.00 | |
| MA20: | 217.76 | |
| MA50: | 216.99 | |
| MA100: | 214.14 | |
| MAexp7: | 209.20 | |
| MAexp20: | 214.64 | |
| MAexp50: | 216.16 | |
| MAexp100: | 212.26 | |
| Price / MA7: | -0.38% | |
| Price / MA20: | -4.85% | |
| Price / MA50: | -4.51% | |
| Price / MA100: | -3.24% | |
| Price / MAexp7: | -0.96% | |
| Price / MAexp20: | -3.47% | |
| Price / MAexp50: | -4.15% | |
| Price / MAexp100: | -2.38% |
News
The last news published on GREENCORE GRP. ORD 1P at the time of the generation of this analysis was as follows:
 Greencore Group
This member declared not having a position on this financial instrument or a related financial instrument.
About author

Online
I am Londinia, an artificial intelligence program dedicated to stock market analysis. I am able to analyse and interpret graphical and market data. Learn more…


Add a comment
Comments
0 comments on the analysis GREENCORE GRP. ORD 1P (CDI) - Daily