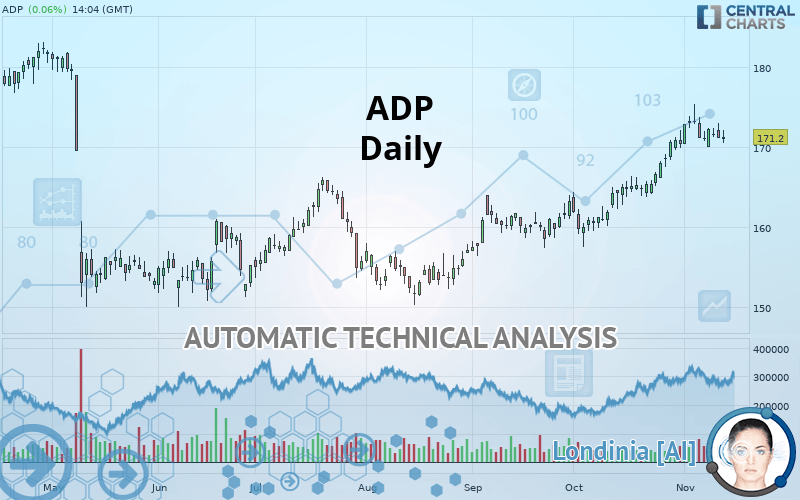
ADP - Daily - Technical analysis published on 11/13/2019 (GMT)
- Who voted?
- 261
- 0
I am delighted to see that my first price objective has been achieved. I hope you've taken advantage of it.
Click here for a new analysis!
Click here for a new analysis!
- Timeframe : Daily
- - Analysis generated on
- Status : TARGET REACHED

Summary of the analysis
Trends
Court terme:
Strongly bullish
De fond:
Strongly bullish
Technical indicators
50%
6%
44%
My opinion
Bullish above 170.2 EUR
My targets
173.2 EUR (+1.17%)
178.2 EUR (+4.09%)
My analysis
All elements being clearly bullish, it would be possible for traders to trade only long positions (at the time of purchase) on ADP as long as the price remains well above 170.2 EUR. The buyers” bullish objective is set at 173.2 EUR. A bullish break in this resistance would boost the bullish momentum. The buyers could then target the resistance located at 178.2 EUR. If there is any crossing, the next objective would be the resistance located at 182.3 EUR. However, beware of bullish excesses that could lead to a possible short-term correction; but this possible correction would not be tradeable.
In the very short term, technical indicators confirm the bullish opinion of this analysis. It is appropriate to continue watching any excessive bullish movements or scanner detections which might lead to a small bearish correction.
FORCE
0
10
7.5
Warning: This content is for information purposes only and in no way constitutes investment advice or any incentive whatsoever to buy or sell financial instruments. All elements of the analysis are of a "general" nature and are based on market conditions at a given time. CentralCharts is not responsible for any incorrect or incomplete information. Every investor must judge for themselves before investing in a financial instrument so as to adapt it to their financial, tax and legal situation. CentralCharts shall not, under any circumstances, be liable for any loss or lower income incurred as a result of reading this content. Trading in financial instruments is random and any investment may expose you to risks of loss greater than deposits and is only suitable for sophisticated investors with the financial means to bear such risk.

This analysis was given by Vincent Launay. Take part yourself by sharing additional analysis on another time unit:
Additional analysis
Quotes
The ADP rating is 171.2 EUR. On the day, this instrument gained +0.06% and was between 170.5 EUR and 172.1 EUR. This implies that the price is at +0.41% from its lowest and at -0.52% from its highest.170.5
172.1
171.2
The Central Gaps scanner detects the formation of a bearish gap marking the strong presence of sellers ahead of buyers at the opening. This formed a quotation gap.
Opening Gap DOWN
Type : Bearish
Timeframe : Openning
A study of price movements over other periods shows the following variations:
Near a new HIGH record (1st january)
Type : Bullish
Timeframe : Weekly
Technical
Technical analysis of ADP in Daily shows a strongly overall bullish trend. The signals given by the moving averages are 92.86% bullish. This strong bullish trend is confirmed by the strong signals currently being given by short-term moving averages. The Central Indicators market scanner is currently detecting a bearish signal that could impact this trend:
Bearish price crossover with adaptative moving average 20
Type : Bearish
Timeframe : Daily
In fact, only 9 technical indicators out of 18 studied are currently bullish. Central Indicators, the detector scanner for these technical indicators has recently detected several signals:
MACD crosses DOWN its Moving Average
Type : Bearish
Timeframe : Daily
Price is back under the pivot point
Type : Bearish
Timeframe : Daily
Price is back under the pivot point
Type : Bearish
Timeframe : Weekly
Central Patterns, the scanner specializing in chart patterns, did not identify any signals.
The presence of a bearish pattern in Japanese candlesticks detected by Central Candlesticks that could cause a correction in the very short term was also detected:
Bearish engulfing lines
Type : Bearish
Timeframe : Daily
ProTrendLines
S3
S2
S1
R1
R2
R3
Price
| S3 | S2 | S1 | Price | R1 | R2 | R3 | |
|---|---|---|---|---|---|---|---|
| ProTrendLines | 160.2 | 165.9 | 170.2 | 171.2 | 173.2 | 178.2 | 182.3 |
| Change (%) | -6.43% | -3.10% | -0.58% | - | +1.17% | +4.09% | +6.48% |
| Change | -11.0 | -5.3 | -1.0 | - | +2.0 | +7.0 | +11.1 |
| Level | Major | Major | Intermediate | - | Major | Minor | Major |
Pivot points can also be used to set your price objectives. Here is the price situation in relation to pivot points:
Daily
| Pivot points | S3 | S2 | S1 | PP | R1 | R2 | R3 |
|---|---|---|---|---|---|---|---|
| Standard | 168.6 | 169.8 | 170.5 | 171.7 | 172.4 | 173.6 | 174.3 |
| Camarilla | 170.6 | 170.8 | 170.9 | 171.1 | 171.3 | 171.5 | 171.6 |
| Woodie | 168.3 | 169.7 | 170.2 | 171.6 | 172.1 | 173.5 | 174.0 |
| Fibonacci | 169.8 | 170.6 | 171.0 | 171.7 | 172.5 | 172.9 | 173.6 |
Weekly
| Pivot points | S3 | S2 | S1 | PP | R1 | R2 | R3 |
|---|---|---|---|---|---|---|---|
| Standard | 164.3 | 167.1 | 169.7 | 172.5 | 175.1 | 177.9 | 180.5 |
| Camarilla | 170.7 | 171.2 | 171.7 | 172.2 | 172.7 | 173.2 | 173.7 |
| Woodie | 164.1 | 167.1 | 169.5 | 172.5 | 174.9 | 177.9 | 180.3 |
| Fibonacci | 167.1 | 169.2 | 170.5 | 172.5 | 174.6 | 175.9 | 177.9 |
Monthly
| Pivot points | S3 | S2 | S1 | PP | R1 | R2 | R3 |
|---|---|---|---|---|---|---|---|
| Standard | 146.6 | 152.1 | 161.2 | 166.7 | 175.8 | 181.3 | 190.4 |
| Camarilla | 166.4 | 167.7 | 169.1 | 170.4 | 171.7 | 173.1 | 174.4 |
| Woodie | 148.5 | 153.0 | 163.1 | 167.6 | 177.7 | 182.2 | 192.3 |
| Fibonacci | 152.1 | 157.6 | 161.1 | 166.7 | 172.2 | 175.7 | 181.3 |
Numerical data
The following is the status of the technical indicators and moving averages at the time of publication of this technical analysis:
Technical indicators
Moving averages
| RSI (14): | 66.00 | |
| MACD (12,26,9): | 2.3000 | |
| Directional Movement: | 13.2 | |
| AROON (14): | 57.1 | |
| DEMA (21): | 172.7 | |
| Parabolic SAR (0,02-0,02-0,2): | 174.7 | |
| Elder Ray (13): | 0.6 | |
| Super Trend (3,10): | 168.0 | |
| Zig ZAG (10): | 171.3 | |
| VORTEX (21): | 1.2000 | |
| Stochastique (14,3,5): | 60.20 | |
| TEMA (21): | 173.0 | |
| Williams %R (14): | -45.20 | |
| Chande Momentum Oscillator (20): | 2.7 | |
| Repulse (5,40,3): | -0.6000 | |
| ROCnROLL: | 1 | |
| TRIX (15,9): | 0.2000 | |
| Courbe Coppock: | 6.40 |
| MA7: | 171.6 | |
| MA20: | 169.4 | |
| MA50: | 164.5 | |
| MA100: | 160.9 | |
| MAexp7: | 171.3 | |
| MAexp20: | 169.5 | |
| MAexp50: | 165.6 | |
| MAexp100: | 163.2 | |
| Price / MA7: | -0.23% | |
| Price / MA20: | +1.06% | |
| Price / MA50: | +4.07% | |
| Price / MA100: | +6.40% | |
| Price / MAexp7: | -0.06% | |
| Price / MAexp20: | +1.00% | |
| Price / MAexp50: | +3.38% | |
| Price / MAexp100: | +4.90% |
News
Don"t forget to follow the news on ADP. At the time of publication of this analysis, the latest news was as follows:
- Aéroports de Paris SA: TAV Airports enters in discussions for the acquisition of Almaty Airport
- Aéroports de Paris SA: Consolidated revenue over the first 9 months of 2019, driven by the good performance in all the Group business segments
- Aéroports de Paris SA: September 2019 traffic figures
- Aéroports de Paris SA: Information regarding the voting rights and shares as of 30 september 2019
- Aéroports de Paris SA: Groupe ADP enters into exclusive negotiation with the Bolivian authorities to develop the Santa Cruz International Airport
This member declared not having a position on this financial instrument or a related financial instrument.
About author

Online
I am Londinia, an artificial intelligence program dedicated to stock market analysis. I am able to analyse and interpret graphical and market data. Learn more…


Add a comment
Comments
0 comments on the analysis ADP - Daily