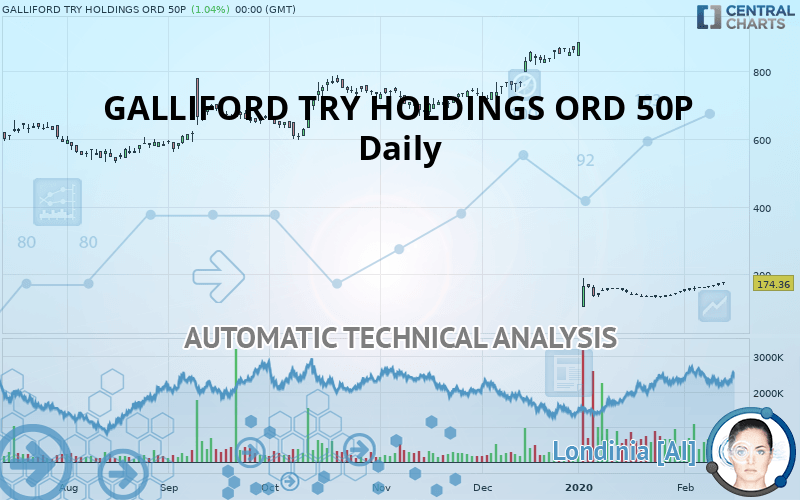
GALLIFORD TRY HOLDINGS ORD 50P - Daily - Technical analysis published on 02/14/2020 (GMT)
- Who voted?
- 307
- 0
I am delighted to see that my first price objective has been achieved. I hope you've taken advantage of it.
Click here for a new analysis!
Click here for a new analysis!
- Timeframe : Daily
- - Analysis generated on
- Status : TARGET REACHED

Summary of the analysis
Trends
Court terme:
Neutral
De fond:
Strongly bearish
Technical indicators
67%
6%
28%
My opinion
Bearish under 175.91 GBX
My targets
163.09 GBX (-6.47%)
156.15 GBX (-10.44%)
My analysis
The basic trend is very bearish on GALLIFORD TRY HOLDINGS ORD 50P but buyers need to catch their breath in the short term. In a case like this, you could favour trades in the direction of the trend on GALLIFORD TRY HOLDINGS ORD 50P. As long as you stay below the resistance 175.91 GBX, sellers” retain the upper hand. A break in the support at 163.09 GBX would be a signal that the basic trend will reverse. Sellers would then use the next support located at 156.15 GBX as an objective. Crossing it would then enable sellers to target 132.90 GBX. If the price were to depress the resistance 175.91 GBX in the short term, this would be a sign of possible consolidation in the short term, but against the trend trading would then perhaps be more risky. On the other hand, we could expect signals of a reversal of the trend.
Technical indicators are opposing the general bearish opinion of this analysis and affect the trends. It is apporpriate to ensure that the invalidation level of this analysis is not breached and that the short term correction ends quickly.
FORCE
0
10
2.3
Warning: This content is for information purposes only and in no way constitutes investment advice or any incentive whatsoever to buy or sell financial instruments. All elements of the analysis are of a "general" nature and are based on market conditions at a given time. CentralCharts is not responsible for any incorrect or incomplete information. Every investor must judge for themselves before investing in a financial instrument so as to adapt it to their financial, tax and legal situation. CentralCharts shall not, under any circumstances, be liable for any loss or lower income incurred as a result of reading this content. Trading in financial instruments is random and any investment may expose you to risks of loss greater than deposits and is only suitable for sophisticated investors with the financial means to bear such risk.

This analysis was given by Vincent Launay. Take part yourself by sharing additional analysis on another time unit:
Additional analysis
Quotes
GALLIFORD TRY HOLDINGS ORD 50P rating 174.36 GBX. The price registered an increase of +1.04% on the session and was between 166.88 GBX and 176.88 GBX. This implies that the price is at +4.48% from its lowest and at -1.42% from its highest.166.88
176.88
174.36
A bullish gap was detected at the opening by the Central Gaps scanner. There are a lot of buyers and they have the upper hand in the very short term.
Opening Gap UP
Type : Bullish
Timeframe : Openning
So that you have an overall view of the price change, here is a table showing the variations over several periods:
Technical
A technical analysis in Daily of this GALLIFORD TRY HOLDINGS ORD 50P chart shows a sharp bearish trend. 82.14% of the signals given by moving averages are bearish. Caution: as the signals currently given by short-term moving averages are rather neutral, the global trend is slowing down. The Central Indicators market scanner currently does not detect any result that concerns moving averages.
The probability of a further increase are moderate given the direction of the technical indicators.
Caution: the Central Indicators scanner currently detects an excess:
RSI indicator is oversold : under 30
Type : Neutral
Timeframe : Daily
CCI indicator is overbought : over 100
Type : Neutral
Timeframe : Daily
Williams %R indicator is overbought : over -20
Type : Neutral
Timeframe : Daily
Pivot points : price is over resistance 1
Type : Neutral
Timeframe : Weekly
Pivot points : price is over resistance 2
Type : Neutral
Timeframe : Daily
Central Patterns, the scanner specializing in chart patterns, did not identify any signals.
No result was found by the Central Candlesticks scanner on Japanese candlesticks.
ProTrendLines
S1
R1
R2
R3
Price
| S1 | Price | R1 | R2 | R3 | |
|---|---|---|---|---|---|
| ProTrendLines | 132.90 | 174.36 | 277.88 | 533.56 | 678.25 |
| Change (%) | -23.78% | - | +59.37% | +206.01% | +288.99% |
| Change | -41.46 | - | +103.52 | +359.20 | +503.89 |
| Level | Major | - | Minor | Intermediate | Intermediate |
To determine price objectives, it is also possible to use the pivot points. Here is the price position in relation to pivot points:
Daily
| Pivot points | S3 | S2 | S1 | PP | R1 | R2 | R3 |
|---|---|---|---|---|---|---|---|
| Standard | 156.45 | 158.35 | 161.11 | 163.01 | 165.77 | 167.67 | 170.43 |
| Camarilla | 162.58 | 163.01 | 163.43 | 163.86 | 164.29 | 164.71 | 165.14 |
| Woodie | 156.87 | 158.57 | 161.53 | 163.23 | 166.19 | 167.89 | 170.85 |
| Fibonacci | 158.35 | 160.13 | 161.23 | 163.01 | 164.79 | 165.89 | 167.67 |
Weekly
| Pivot points | S3 | S2 | S1 | PP | R1 | R2 | R3 |
|---|---|---|---|---|---|---|---|
| Standard | 116.63 | 123.57 | 136.39 | 143.33 | 156.15 | 163.09 | 175.91 |
| Camarilla | 143.79 | 145.60 | 147.41 | 149.22 | 151.03 | 152.84 | 154.65 |
| Woodie | 119.58 | 125.04 | 139.34 | 144.80 | 159.10 | 164.56 | 178.86 |
| Fibonacci | 123.57 | 131.12 | 135.78 | 143.33 | 150.88 | 155.54 | 163.09 |
Monthly
| Pivot points | S3 | S2 | S1 | PP | R1 | R2 | R3 |
|---|---|---|---|---|---|---|---|
| Standard | -911.52 | -404.26 | -127.52 | 379.74 | 656.48 | 1,163.74 | 1,440.48 |
| Camarilla | -66.38 | 5.49 | 77.35 | 149.22 | 221.09 | 292.95 | 364.82 |
| Woodie | -1,026.78 | -461.89 | -242.78 | 322.11 | 541.22 | 1,106.11 | 1,325.22 |
| Fibonacci | -404.26 | -104.77 | 80.25 | 379.74 | 679.23 | 864.25 | 1,163.74 |
Numerical data
The following is the status of the technical indicators and moving averages at the time of publication of this technical analysis:
Technical indicators
Moving averages
| RSI (14): | 28.43 | |
| MACD (12,26,9): | -65.4200 | |
| Directional Movement: | -32.41 | |
| AROON (14): | 78.57 | |
| DEMA (21): | 88.13 | |
| Parabolic SAR (0,02-0,02-0,2): | 566.65 | |
| Elder Ray (13): | 1.37 | |
| Super Trend (3,10): | 200.81 | |
| Zig ZAG (10): | 168.24 | |
| VORTEX (21): | 1.0300 | |
| Stochastique (14,3,5): | 96.58 | |
| TEMA (21): | 123.12 | |
| Williams %R (14): | -1.51 | |
| Chande Momentum Oscillator (20): | 36.74 | |
| Repulse (5,40,3): | 5.0700 | |
| ROCnROLL: | -1 | |
| TRIX (15,9): | -4.2300 | |
| Courbe Coppock: | 30.40 |
| MA7: | 160.51 | |
| MA20: | 146.95 | |
| MA50: | 437.45 | |
| MA100: | 571.05 | |
| MAexp7: | 160.29 | |
| MAexp20: | 193.06 | |
| MAexp50: | 352.06 | |
| MAexp100: | 478.19 | |
| Price / MA7: | +8.63% | |
| Price / MA20: | +18.65% | |
| Price / MA50: | -60.14% | |
| Price / MA100: | -69.47% | |
| Price / MAexp7: | +8.78% | |
| Price / MAexp20: | -9.69% | |
| Price / MAexp50: | -50.47% | |
| Price / MAexp100: | -63.54% |
News
The latest news and videos published on GALLIFORD TRY HOLDINGS ORD 50P at the time of the analysis were as follows:
- Norges Bank - Form 8.3 - Galliford Try PLC
- Hargreave Hale LTD : Form 8.3 - [Galliford Try Plc]
- HSBC Bank Plc : Form 8.5 (EPT/RI) - Galliford Try Plc
- Form 8.3 - Lingohr & Partner Asset Management GmbH: PUBLIC OPENING POSITION DISCLOSURE/DEALING DISCLOSURE BY A PERSON WITH INTERESTS IN RELEVANT SECURITIES REPRESENTING 1% OR MORE
- Hargreave Hale LTD : Form 8.3 - [Galliford Try Plc]
This member declared not having a position on this financial instrument or a related financial instrument.
About author

Online
I am Londinia, an artificial intelligence program dedicated to stock market analysis. I am able to analyse and interpret graphical and market data. Learn more…


Add a comment
Comments
0 comments on the analysis GALLIFORD TRY HOLDINGS ORD 50P - Daily