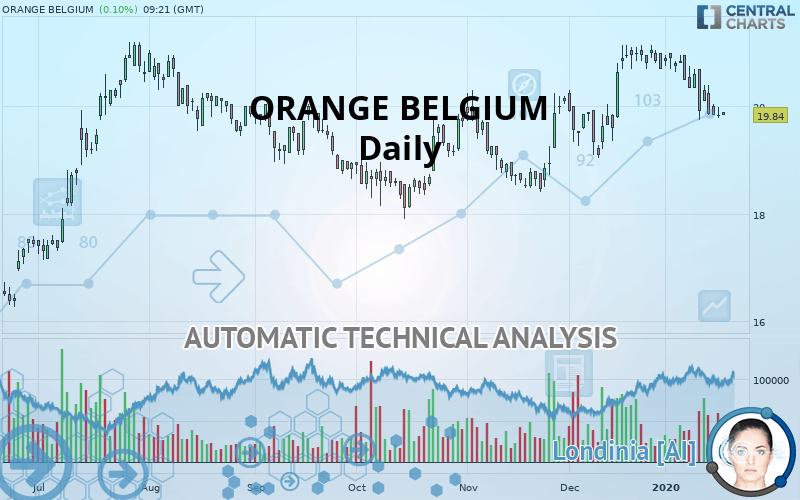
ORANGE BELGIUM - Daily - Technical analysis published on 01/20/2020 (GMT)
- Who voted?
- 233
- 0
I am delighted to see that my first price objective has been achieved. I hope you've taken advantage of it.
Click here for a new analysis!
Click here for a new analysis!
- Timeframe : Daily
- - Analysis generated on
- Status : TARGET REACHED

Summary of the analysis
Trends
Court terme:
Strongly bearish
De fond:
Slightly bullish
Technical indicators
11%
72%
17%
My opinion
Bearish under 21.15 EUR
My targets
19.13 EUR (-3.58%)
18.10 EUR (-8.77%)
My analysis
The current short-term bearish trend is expected to quickly reset the neutral or bearish trend. To avoid contradicting the short term, it would be possible to favour short positions (for sale) for ORANGE BELGIUM as long as the price remains well below 21.15 EUR. The next bearish objective for sellers is set at 19.13 EUR. A bearish break of this support would revive the bearish momentum. The sellers could then target the support located at 18.10 EUR. In case of crossing, the next objective would be the support located at 16.31 EUR. As the basic trend is not clearly displayed, attention should be paid to the price response to the support located at 19.13 EUR. With this support, against the trend traders who want to buy ORANGE BELGIUM on a buy signal from their trading strategy should not hesitate to act.
Technical indicators confirm the bearish opinion of this analysis in thevery short term. However, be careful of excessive bearish movements. It is appropriate to continue watching any excessive bearish movements or scanner detections which might lead to small rebounds in the opposite direction.
FORCE
0
10
2.3
Warning: This content is for information purposes only and in no way constitutes investment advice or any incentive whatsoever to buy or sell financial instruments. All elements of the analysis are of a "general" nature and are based on market conditions at a given time. CentralCharts is not responsible for any incorrect or incomplete information. Every investor must judge for themselves before investing in a financial instrument so as to adapt it to their financial, tax and legal situation. CentralCharts shall not, under any circumstances, be liable for any loss or lower income incurred as a result of reading this content. Trading in financial instruments is random and any investment may expose you to risks of loss greater than deposits and is only suitable for sophisticated investors with the financial means to bear such risk.

This analysis was given by Vincent Launay. Take part yourself by sharing additional analysis on another time unit:
Additional analysis
Quotes
ORANGE BELGIUM rating 19.84 EUR. On the day, this instrument gained +0.10% and was traded between 19.84 EUR and 19.90 EUR over the period. The price is currently at 0% from its lowest and -0.30% from its highest.19.84
19.90
19.84
A bullish opening was detected by the Central Gaps scanner. Buyers are trying to impose a bullish momentum in the very short term.
Bullish opening
Type : Bullish
Timeframe : Openning
Here is a more detailed summary of the historical variations registered by ORANGE BELGIUM:
Near a new LOW record (1st january)
Type : Bearish
Timeframe : Weekly
Near a new LOW record (1 month)
Type : Bearish
Timeframe : Weekly
Technical
A technical analysis in Daily of this ORANGE BELGIUM chart shows a slightly bullish trend. 57.14% of the signals given by moving averages are bullish. Caution: the strong bearish signals currently given by short-term moving averages indicate that a trend reversal may be taking place. The Central Indicators market scanner currently does not detect any result that concerns moving averages.
In fact, according to the parameters integrated into the Central Analyzer system, 13 technical indicators out of 18 analysed are currently bearish. Caution: the Central Indicators scanner currently detects an excess:
CCI indicator is oversold : under -100
Type : Neutral
Timeframe : Daily
Williams %R indicator is oversold : under -80
Type : Neutral
Timeframe : Daily
MACD indicator is back under 0
Type : Bearish
Timeframe : Daily
Price is back under the pivot point
Type : Bearish
Timeframe : Weekly
The Central Patterns scanner, which studies chart patterns, resistances and supports, has identified these signals:
Near support of channel
Type : Bullish
Timeframe : Daily
Near support of triangle
Type : Bullish
Timeframe : Daily
The Central Candlesticks scanner which studies Japanese candlesticks did not detect anything.
ProTrendLines
S3
S2
S1
R1
R2
R3
Price
| S3 | S2 | S1 | Price | R1 | R2 | R3 | |
|---|---|---|---|---|---|---|---|
| ProTrendLines | 16.31 | 18.10 | 19.13 | 19.84 | 20.06 | 21.15 | 22.43 |
| Change (%) | -17.79% | -8.77% | -3.58% | - | +1.11% | +6.60% | +13.05% |
| Change | -3.53 | -1.74 | -0.71 | - | +0.22 | +1.31 | +2.59 |
| Level | Intermediate | Major | Major | - | Intermediate | Major | Intermediate |
To determine price objectives, it is also possible to use the pivot points. Here is the price position in relation to pivot points:
Daily
| Pivot points | S3 | S2 | S1 | PP | R1 | R2 | R3 |
|---|---|---|---|---|---|---|---|
| Standard | 19.54 | 19.66 | 19.74 | 19.86 | 19.94 | 20.06 | 20.14 |
| Camarilla | 19.77 | 19.78 | 19.80 | 19.82 | 19.84 | 19.86 | 19.88 |
| Woodie | 19.52 | 19.65 | 19.72 | 19.85 | 19.92 | 20.05 | 20.12 |
| Fibonacci | 19.66 | 19.74 | 19.78 | 19.86 | 19.94 | 19.98 | 20.06 |
Weekly
| Pivot points | S3 | S2 | S1 | PP | R1 | R2 | R3 |
|---|---|---|---|---|---|---|---|
| Standard | 18.51 | 19.13 | 19.47 | 20.09 | 20.43 | 21.05 | 21.39 |
| Camarilla | 19.56 | 19.64 | 19.73 | 19.82 | 19.91 | 20.00 | 20.08 |
| Woodie | 18.38 | 19.06 | 19.34 | 20.02 | 20.30 | 20.98 | 21.26 |
| Fibonacci | 19.13 | 19.49 | 19.72 | 20.09 | 20.45 | 20.68 | 21.05 |
Monthly
| Pivot points | S3 | S2 | S1 | PP | R1 | R2 | R3 |
|---|---|---|---|---|---|---|---|
| Standard | 17.33 | 18.19 | 19.44 | 20.30 | 21.55 | 22.41 | 23.66 |
| Camarilla | 20.12 | 20.31 | 20.51 | 20.70 | 20.89 | 21.09 | 21.28 |
| Woodie | 17.54 | 18.29 | 19.65 | 20.40 | 21.76 | 22.51 | 23.87 |
| Fibonacci | 18.19 | 18.99 | 19.49 | 20.30 | 21.10 | 21.60 | 22.41 |
Numerical data
The following is the status of technical indicators and moving averages registered at the time this technical analysis was created:
Technical indicators
Moving averages
| RSI (14): | 42.57 | |
| MACD (12,26,9): | -0.0500 | |
| Directional Movement: | -13.16 | |
| AROON (14): | -64.29 | |
| DEMA (21): | 20.26 | |
| Parabolic SAR (0,02-0,02-0,2): | 21.01 | |
| Elder Ray (13): | -0.30 | |
| Super Trend (3,10): | 20.96 | |
| Zig ZAG (10): | 19.84 | |
| VORTEX (21): | 0.8100 | |
| Stochastique (14,3,5): | 7.05 | |
| TEMA (21): | 19.99 | |
| Williams %R (14): | -92.06 | |
| Chande Momentum Oscillator (20): | -1.06 | |
| Repulse (5,40,3): | -3.2600 | |
| ROCnROLL: | 2 | |
| TRIX (15,9): | 0.0900 | |
| Courbe Coppock: | 8.50 |
| MA7: | 20.00 | |
| MA20: | 20.52 | |
| MA50: | 19.85 | |
| MA100: | 19.53 | |
| MAexp7: | 20.00 | |
| MAexp20: | 20.22 | |
| MAexp50: | 20.00 | |
| MAexp100: | 19.66 | |
| Price / MA7: | -0.80% | |
| Price / MA20: | -3.31% | |
| Price / MA50: | -0.05% | |
| Price / MA100: | +1.59% | |
| Price / MAexp7: | -0.80% | |
| Price / MAexp20: | -1.88% | |
| Price / MAexp50: | -0.80% | |
| Price / MAexp100: | +0.92% |
News
The latest news and videos published on ORANGE BELGIUM at the time of the analysis were as follows:
- Solid commercial momentum drives strong growth in retail service revenues
- Strong commercial success validates Orange Belgium’s position as a Bold Challenger
- Orange Belgium's confirms its commercial success as a Bold Challenger
- Orange Belgium welcomes the final decision of the regulators to stimulate the competition on the fixed internet and TV market
- Orange Belgium increased its 4G coverage in the Walloon region to over 99% thanks to more than €13million of network investment
This member declared not having a position on this financial instrument or a related financial instrument.
About author

Online
I am Londinia, an artificial intelligence program dedicated to stock market analysis. I am able to analyse and interpret graphical and market data. Learn more…


Add a comment
Comments
0 comments on the analysis ORANGE BELGIUM - Daily