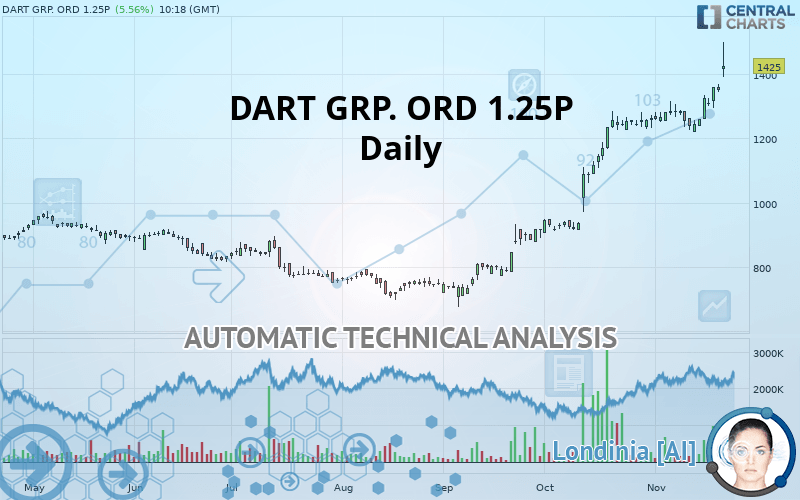
DART GRP. ORD 1.25P - Daily - Technical analysis published on 11/21/2019 (GMT)
- Who voted?
- 315
- 0
Click here for a new analysis!
- Timeframe : Daily
- - Analysis generated on
- Status : TARGET REACHED

Summary of the analysis
Additional analysis
Quotes
DART GRP. ORD 1.25P rating 1,425 GBX. The price registered an increase of +5.56% on the session and was traded between 1,390 GBX and 1,500 GBX over the period. The price is currently at +2.52% from its lowest and -5.00% from its highest.A bullish gap was detected at the opening by the Central Gaps scanner. There are a lot of buyers and they have the upper hand in the very short term.
Opening Gap UP
Type : Bullish
Timeframe : Openning
So that you have an overall view of the price change, here is a table showing the variations over several periods:
New HIGH record (5 years)
Type : Bullish
Timeframe : Weekly
New HIGH record (1 year)
Type : Bullish
Timeframe : Weekly
New HIGH record (1st january)
Type : Bullish
Timeframe : Weekly
New HIGH record (1 month)
Type : Bullish
Timeframe : Weekly
The Central Volumes scanner notes the presence of abnormal volumes:
Abnormal volumes
Timeframe : 5 days
Abnormal volumes
Timeframe : 50 days
Technical
A technical analysis in Daily of this DART GRP. ORD 1.25P chart shows a strongly bullish trend. 92.86% of the signals given by moving averages are bullish. This strongly bullish trend is supported by the strong bullish signals given by short-term moving averages. The Central Indicators market scanner currently does not detect any result that concerns moving averages.
In fact, 14 technical indicators on 18 studied are currently positioned bullish. But beware of excesses. The Central Indicators scanner currently detects this:
RSI indicator is overbought : over 80
Type : Neutral
Timeframe : Daily
CCI indicator is overbought : over 100
Type : Neutral
Timeframe : Daily
Williams %R indicator is overbought : over -20
Type : Neutral
Timeframe : Daily
Pivot points : price is over resistance 2
Type : Neutral
Timeframe : Weekly
Pivot points : price is over resistance 3
Type : Neutral
Timeframe : Daily
MACD crosses UP its Moving Average
Type : Bullish
Timeframe : Daily
Price is back under the pivot point
Type : Bearish
Timeframe : Daily
No signals are given by Central Patterns, a market scanner specialised in chart patterns, resistances and supports.
No result was found by the Central Candlesticks scanner on Japanese candlesticks.
| S3 | S2 | S1 | Price | |
|---|---|---|---|---|
| ProTrendLines | 960 | 1,017 | 1,240 | 1,425 |
| Change (%) | -32.63% | -28.63% | -12.98% | - |
| Change | -465 | -408 | -185 | - |
| Level | Minor | Major | Major | - |
To determine price objectives, it is also possible to use the pivot points. Here is the price position in relation to pivot points:
| Pivot points | S3 | S2 | S1 | PP | R1 | R2 | R3 |
|---|---|---|---|---|---|---|---|
| Standard | 1,317 | 1,330 | 1,340 | 1,354 | 1,364 | 1,378 | 1,388 |
| Camarilla | 1,344 | 1,346 | 1,348 | 1,350 | 1,352 | 1,354 | 1,357 |
| Woodie | 1,314 | 1,329 | 1,338 | 1,353 | 1,362 | 1,377 | 1,386 |
| Fibonacci | 1,330 | 1,340 | 1,345 | 1,354 | 1,363 | 1,369 | 1,378 |
| Pivot points | S3 | S2 | S1 | PP | R1 | R2 | R3 |
|---|---|---|---|---|---|---|---|
| Standard | 1,138 | 1,180 | 1,252 | 1,294 | 1,366 | 1,408 | 1,480 |
| Camarilla | 1,294 | 1,304 | 1,315 | 1,325 | 1,335 | 1,346 | 1,356 |
| Woodie | 1,154 | 1,188 | 1,268 | 1,302 | 1,382 | 1,416 | 1,496 |
| Fibonacci | 1,180 | 1,223 | 1,250 | 1,294 | 1,337 | 1,364 | 1,408 |
| Pivot points | S3 | S2 | S1 | PP | R1 | R2 | R3 |
|---|---|---|---|---|---|---|---|
| Standard | 636 | 771 | 1,018 | 1,153 | 1,400 | 1,535 | 1,782 |
| Camarilla | 1,160 | 1,195 | 1,230 | 1,265 | 1,300 | 1,335 | 1,370 |
| Woodie | 692 | 799 | 1,074 | 1,181 | 1,456 | 1,563 | 1,838 |
| Fibonacci | 771 | 917 | 1,007 | 1,153 | 1,299 | 1,389 | 1,535 |
Numerical data
The following is the status of technical indicators and moving averages registered at the time this technical analysis was created:
| RSI (14): | 81.00 | |
| MACD (12,26,9): | 68.0000 | |
| Directional Movement: | 43 | |
| AROON (14): | 43 | |
| DEMA (21): | 1,371 | |
| Parabolic SAR (0,02-0,02-0,2): | 1,239 | |
| Elder Ray (13): | 135 | |
| Super Trend (3,10): | 1,297 | |
| Zig ZAG (10): | 1,426 | |
| VORTEX (21): | 1.0000 | |
| Stochastique (14,3,5): | 87.00 | |
| TEMA (21): | 1,365 | |
| Williams %R (14): | -26.00 | |
| Chande Momentum Oscillator (20): | 146 | |
| Repulse (5,40,3): | 2.0000 | |
| ROCnROLL: | 1 | |
| TRIX (15,9): | 1.0000 | |
| Courbe Coppock: | 11.00 |
| MA7: | 1,331 | |
| MA20: | 1,285 | |
| MA50: | 1,104 | |
| MA100: | 935 | |
| MAexp7: | 1,352 | |
| MAexp20: | 1,276 | |
| MAexp50: | 1,141 | |
| MAexp100: | 1,022 | |
| Price / MA7: | +7.06% | |
| Price / MA20: | +10.89% | |
| Price / MA50: | +29.08% | |
| Price / MA100: | +52.41% | |
| Price / MAexp7: | +5.40% | |
| Price / MAexp20: | +11.68% | |
| Price / MAexp50: | +24.89% | |
| Price / MAexp100: | +39.43% |
News
The last news published on DART GRP. ORD 1.25P at the time of the generation of this analysis was as follows:
- US Defense Innovation Unit Selects D-Fend Solutions' Counter Drone System During Black Dart 2019
- US Defense Innovation Unit Selects D-Fend Solutions' Counter Drone System During Black Dart 2019
- Dart Container Corporation Partners with Keep America Beautiful on National Plogging Initiatives
-
 Dart Mining has golden focus with new funds and push into Buckland project in northeast Victoria
-
Dart Mining has golden focus with new funds and push into Buckland project in northeast Victoria
About author

Online


Add a comment
Comments
0 comments on the analysis DART GRP. ORD 1.25P - Daily