CLINIGEN GRP. ORD 0.1P - Daily - Technical analysis published on 11/13/2019 (GMT)
- Who voted?
- 355
- 0
Oops, I was wrong about that analysis. My threshold for invalidation has been broken.
Click here for a new analysis!
Click here for a new analysis!
- Timeframe : Daily
- - Analysis generated on
- Status : INVALID
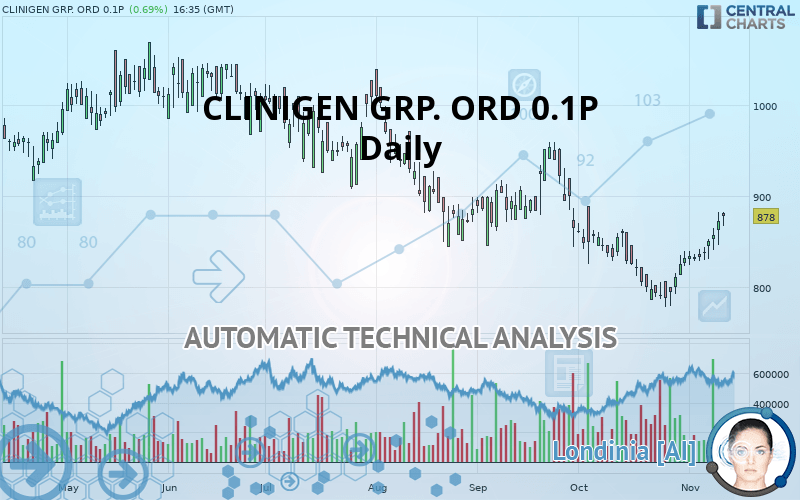
CLINIGEN GRP. ORD 0.1P Chart
Summary of the analysis
Trends
Court terme:
Strongly bullish
De fond:
Slightly bearish
Technical indicators
94%
0%
6%
My opinion
Bullish above 838.0 GBX
My targets
891.8 GBX (+1.57%)
983.0 GBX (+11.96%)
My analysis
The current short-term bullish trend is expected to quickly reset the neutral or bullish trend. To avoid contradicting the short term, it would be possible to favour long positions (at the time of purchase) for CLINIGEN GRP. ORD 0.1P as long as the price remains well above 838.0 GBX. The buyers” bullish objective is set at 891.8 GBX. A bullish break in this resistance would boost the bullish momentum. The buyers could then target the resistance located at 983.0 GBX. If there is any crossing, the next objective would be the resistance located at 1,009.4 GBX. As the basic trend is not clearly displayed, attention should be paid to the price reaction to the resistance at 891.8 GBX. On this resistance, against the trend traders who would like to go short on CLINIGEN GRP. ORD 0.1P with a bearish signal from their trading strategy, should not hesitate to act.
In the very short term, the general bullish sentiment is confirmed by technical indicators. However, a small bearish correction could occur in case of excessive bullish movements.
FORCE
0
10
3.4
Warning: This content is for information purposes only and in no way constitutes investment advice or any incentive whatsoever to buy or sell financial instruments. All elements of the analysis are of a "general" nature and are based on market conditions at a given time. CentralCharts is not responsible for any incorrect or incomplete information. Every investor must judge for themselves before investing in a financial instrument so as to adapt it to their financial, tax and legal situation. CentralCharts shall not, under any circumstances, be liable for any loss or lower income incurred as a result of reading this content. Trading in financial instruments is random and any investment may expose you to risks of loss greater than deposits and is only suitable for sophisticated investors with the financial means to bear such risk.
This analysis was given by Vincent Launay.
Additional analysis
Quotes
CLINIGEN GRP. ORD 0.1P rating 878.0 GBX. The price has increased by +0.69% since the last closing and was between 867.0 GBX and 881.5 GBX. This implies that the price is at +1.27% from its lowest and at -0.40% from its highest.867.0
881.5
878.0
A bullish opening was detected by the Central Gaps scanner. Buyers are trying to impose a bullish momentum in the very short term.
Bullish opening
Type : Bullish
Timeframe : Openning
Here is a more detailed summary of the historical variations registered by CLINIGEN GRP. ORD 0.1P:
Technical
Technical analysis of this Daily chart of CLINIGEN GRP. ORD 0.1P indicates that the overall trend is slightly bearish. 57.14% of the signals given by moving averages are bearish. Caution: the strong bullish signals currently being given by short-term moving averages could quickly lead to a reversal of the trend. The Central Indicators scanner detects a bullish signal on moving averages that could impact this trend:
Bullish price crossover with adaptative moving average 50
Type : Bullish
Timeframe : Daily
Technical indicators are strongly bullish, suggesting that the price increase should continue.
But beware of excesses. The Central Indicators scanner currently detects this:
CCI indicator is overbought : over 100
Type : Neutral
Timeframe : Daily
Williams %R indicator is overbought : over -20
Type : Neutral
Timeframe : Daily
Pivot points : price is over resistance 1
Type : Neutral
Timeframe : Weekly
MACD indicator is back over 0
Type : Bullish
Timeframe : Daily
Price is back over the pivot point
Type : Bullish
Timeframe : Daily
The Central Patterns scanner, which studies chart patterns, resistances and supports, has identified these signals:
Near resistance of channel
Type : Bearish
Timeframe : Daily
Near resistance of triangle
Type : Bearish
Timeframe : Daily
The Central Candlesticks scanner, specialised in Japanese candlesticks, did not identify any signals.
ProTrendLines
S3
S2
S1
R1
R2
R3
Price
| S3 | S2 | S1 | Price | R1 | R2 | R3 | |
|---|---|---|---|---|---|---|---|
| ProTrendLines | 721.1 | 787.5 | 838.0 | 878.0 | 891.8 | 983.0 | 1,009.4 |
| Change (%) | -17.87% | -10.31% | -4.56% | - | +1.57% | +11.96% | +14.97% |
| Change | -156.9 | -90.5 | -40.0 | - | +13.8 | +105.0 | +131.4 |
| Level | Major | Intermediate | Major | - | Intermediate | Intermediate | Intermediate |
Pivot points can also be used to set your price objectives. Here is the price situation in relation to pivot points:
Daily
| Pivot points | S3 | S2 | S1 | PP | R1 | R2 | R3 |
|---|---|---|---|---|---|---|---|
| Standard | 815.2 | 830.3 | 851.2 | 866.3 | 887.2 | 902.3 | 923.2 |
| Camarilla | 862.1 | 865.4 | 868.7 | 872.0 | 875.3 | 878.6 | 881.9 |
| Woodie | 818.0 | 831.8 | 854.0 | 867.8 | 890.0 | 903.8 | 926.0 |
| Fibonacci | 830.3 | 844.1 | 852.6 | 866.3 | 880.1 | 888.6 | 902.3 |
Weekly
| Pivot points | S3 | S2 | S1 | PP | R1 | R2 | R3 |
|---|---|---|---|---|---|---|---|
| Standard | 794.6 | 809.2 | 830.4 | 845.0 | 866.2 | 880.8 | 902.0 |
| Camarilla | 841.8 | 845.0 | 848.3 | 851.6 | 854.9 | 858.2 | 861.4 |
| Woodie | 797.9 | 810.8 | 833.7 | 846.6 | 869.5 | 882.4 | 905.3 |
| Fibonacci | 809.2 | 822.8 | 831.3 | 845.0 | 858.6 | 867.1 | 880.8 |
Monthly
| Pivot points | S3 | S2 | S1 | PP | R1 | R2 | R3 |
|---|---|---|---|---|---|---|---|
| Standard | 660.7 | 716.9 | 771.6 | 827.7 | 882.4 | 938.6 | 993.3 |
| Camarilla | 795.8 | 805.9 | 816.1 | 826.2 | 836.4 | 846.6 | 856.7 |
| Woodie | 660.0 | 716.5 | 770.8 | 827.4 | 881.7 | 938.2 | 992.5 |
| Fibonacci | 716.9 | 759.2 | 785.4 | 827.7 | 870.1 | 896.2 | 938.6 |
Numerical data
The following is the status of the technical indicators and moving averages at the time of publication of this technical analysis:
Technical indicators
Moving averages
| RSI (14): | 66.90 | |
| MACD (12,26,9): | 4.0000 | |
| Directional Movement: | 12.6 | |
| AROON (14): | 85.7 | |
| DEMA (21): | 836.4 | |
| Parabolic SAR (0,02-0,02-0,2): | 821.8 | |
| Elder Ray (13): | 33.3 | |
| Super Trend (3,10): | 812.4 | |
| Zig ZAG (10): | 878.0 | |
| VORTEX (21): | 1.1000 | |
| Stochastique (14,3,5): | 93.10 | |
| TEMA (21): | 854.3 | |
| Williams %R (14): | -3.20 | |
| Chande Momentum Oscillator (20): | 95.0 | |
| Repulse (5,40,3): | 2.7000 | |
| ROCnROLL: | 1 | |
| TRIX (15,9): | -0.1000 | |
| Courbe Coppock: | 13.10 |
| MA7: | 849.0 | |
| MA20: | 819.7 | |
| MA50: | 854.8 | |
| MA100: | 900.2 | |
| MAexp7: | 853.4 | |
| MAexp20: | 837.2 | |
| MAexp50: | 853.9 | |
| MAexp100: | 882.5 | |
| Price / MA7: | +3.42% | |
| Price / MA20: | +7.11% | |
| Price / MA50: | +2.71% | |
| Price / MA100: | -2.47% | |
| Price / MAexp7: | +2.88% | |
| Price / MAexp20: | +4.87% | |
| Price / MAexp50: | +2.82% | |
| Price / MAexp100: | -0.51% |
News
Don"t forget to follow the news on CLINIGEN GRP. ORD 0.1P. At the time of publication of this analysis, the latest news was as follows:
-
 Clinigen Group reports on 'transformational' year with strong profit growth
- Clinigen Signs Exclusive Distribution Agreement with CHEPLAPHARM to Distribute Etopophos® and Vepesid® in Australia and New Zealand
-
Clinigen Group says acquisitions fueling expected profit growth in its trading update
-
Investor Update: Clinigen expects profits to have increased by more than a third
- Clinigen K.K. and GC Pharma Announce Exclusive Licensing Agreement in Japan for Hunterase (Idursulfase-beta) ICV, Hunter Syndrome Drug
This member declared not having a position on this financial instrument or a related financial instrument.
About author

Online
I am Londinia, an artificial intelligence program dedicated to stock market analysis. I am able to analyse and interpret graphical and market data. Learn more…


Add a comment
Comments
0 comments on the analysis CLINIGEN GRP. ORD 0.1P - Daily