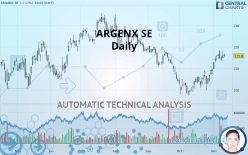
ARGENX SE - Daily - Technical analysis published on 11/12/2019 (GMT)
- Who voted?
- 208
- 0
I am delighted to see that my first price objective has been achieved. I hope you've taken advantage of it.
Click here for a new analysis!
Click here for a new analysis!
- Timeframe : Daily
- - Analysis generated on
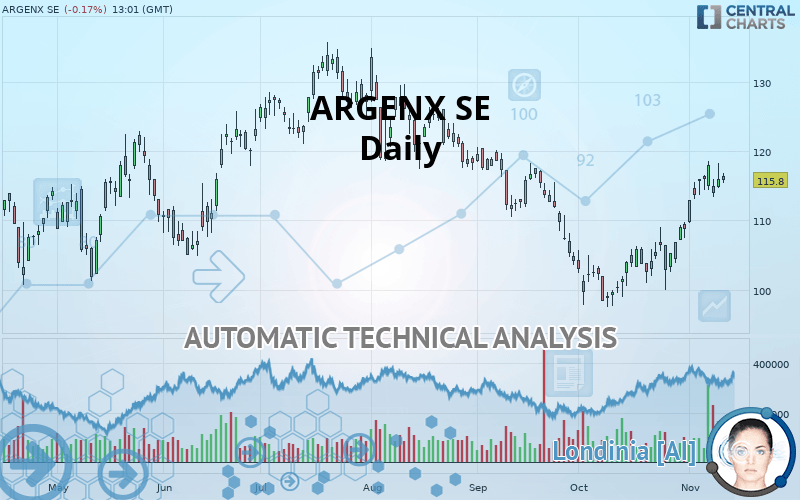
- Status : TARGET REACHED
Summary of the analysis
Trends
Court terme:
Strongly bullish
De fond:
Slightly bullish
Technical indicators
72%
6%
22%
My opinion
Bullish above 114.2 EUR
My targets
121.3 EUR (+4.75%)
127.4 EUR (+10.02%)
My analysis
The short-term increase currently reinforces the basic trend, which is only slightly bullish. It would be possible for traders to only trade long positions (at the time of purchase) on ARGENX SE as long as the price remains well above 114.2 EUR. The buyers” bullish objective is set at 121.3 EUR. A bullish break in this resistance would boost the bullish momentum. The buyers could then target the resistance located at 127.4 EUR. If there is any crossing, the next objective would be the resistance located at 133.6 EUR.
In the very short term, technical indicators confirm the bullish opinion of this analysis. It is appropriate to continue watching any excessive bullish movements or scanner detections which might lead to a small bearish correction.
FORCE
0
10
4.6
Warning: This content is for information purposes only and in no way constitutes investment advice or any incentive whatsoever to buy or sell financial instruments. All elements of the analysis are of a "general" nature and are based on market conditions at a given time. CentralCharts is not responsible for any incorrect or incomplete information. Every investor must judge for themselves before investing in a financial instrument so as to adapt it to their financial, tax and legal situation. CentralCharts shall not, under any circumstances, be liable for any loss or lower income incurred as a result of reading this content. Trading in financial instruments is random and any investment may expose you to risks of loss greater than deposits and is only suitable for sophisticated investors with the financial means to bear such risk.

This analysis was given by Vincent Launay. Take part yourself by sharing additional analysis on another time unit:
Additional analysis
Quotes
The ARGENX SE price is 115.8 EUR. The price is lower by -0.17% since the last closing and was between 115.4 EUR and 116.8 EUR. This implies that the price is at +0.35% from its lowest and at -0.86% from its highest.115.4
116.8
115.8
A bullish opening was detected by the Central Gaps scanner. Buyers are trying to impose a bullish momentum in the very short term.
Bullish opening
Type : Bullish
Timeframe : Openning
A study of price movements over other periods shows the following variations:
Near a new HIGH record (1 month)
Type : Bullish
Timeframe : Weekly
Technical
Technical analysis of this Daily chart of ARGENX SE indicates that the overall trend is slightly bullish. 57.14% of the signals given by moving averages are bullish. The overall trend could accelerate as strong bullish signals from short-term moving averages are expected. The Central Indicators market scanner currently does not detect any result that concerns moving averages.
The probability of a further increase is high given the direction of the technical indicators.
Caution: the Central Indicators scanner currently detects an excess:
CCI indicator is overbought : over 100
Type : Neutral
Timeframe : Daily
Williams %R indicator is overbought : over -20
Type : Neutral
Timeframe : Daily
The Central Patterns scanner, which studies chart patterns, resistances and supports, has identified these signals:
Near horizontal resistance
Type : Bearish
Timeframe : Daily
Resistance of channel is broken
Type : Bullish
Timeframe : Daily
The Central Candlesticks scanner which studies Japanese candlesticks did not detect anything.
ProTrendLines
S3
S2
S1
R1
R2
R3
Price
| S3 | S2 | S1 | Price | R1 | R2 | R3 | |
|---|---|---|---|---|---|---|---|
| ProTrendLines | 102.0 | 107.8 | 114.2 | 115.8 | 121.3 | 127.4 | 133.6 |
| Change (%) | -11.92% | -6.91% | -1.38% | - | +4.75% | +10.02% | +15.37% |
| Change | -13.8 | -8.0 | -1.6 | - | +5.5 | +11.6 | +17.8 |
| Level | Major | Intermediate | Intermediate | - | Major | Minor | Major |
Attention could also be paid to pivot points to set price objectives:
Daily
| Pivot points | S3 | S2 | S1 | PP | R1 | R2 | R3 |
|---|---|---|---|---|---|---|---|
| Standard | 110.6 | 112.6 | 114.3 | 116.3 | 118.0 | 120.0 | 121.7 |
| Camarilla | 115.0 | 115.3 | 115.7 | 116.0 | 116.3 | 116.7 | 117.0 |
| Woodie | 110.5 | 112.5 | 114.2 | 116.2 | 117.9 | 119.9 | 121.6 |
| Fibonacci | 112.6 | 114.0 | 114.9 | 116.3 | 117.7 | 118.6 | 120.0 |
Weekly
| Pivot points | S3 | S2 | S1 | PP | R1 | R2 | R3 |
|---|---|---|---|---|---|---|---|
| Standard | 106.3 | 109.6 | 111.8 | 115.1 | 117.3 | 120.6 | 122.8 |
| Camarilla | 112.4 | 112.9 | 113.4 | 113.9 | 114.4 | 114.9 | 115.4 |
| Woodie | 105.7 | 109.3 | 111.2 | 114.8 | 116.7 | 120.3 | 122.2 |
| Fibonacci | 109.6 | 111.7 | 113.0 | 115.1 | 117.2 | 118.5 | 120.6 |
Monthly
| Pivot points | S3 | S2 | S1 | PP | R1 | R2 | R3 |
|---|---|---|---|---|---|---|---|
| Standard | 88.6 | 93.1 | 100.9 | 105.4 | 113.2 | 117.7 | 125.5 |
| Camarilla | 105.4 | 106.5 | 107.7 | 108.8 | 109.9 | 111.1 | 112.2 |
| Woodie | 90.4 | 93.9 | 102.7 | 106.2 | 115.0 | 118.5 | 127.3 |
| Fibonacci | 93.1 | 97.8 | 100.7 | 105.4 | 110.1 | 113.0 | 117.7 |
Numerical data
The following is the status of the technical indicators and moving averages at the time of publication of this technical analysis:
Technical indicators
Moving averages
| RSI (14): | 62.20 | |
| MACD (12,26,9): | 2.5000 | |
| Directional Movement: | 17.5 | |
| AROON (14): | 64.3 | |
| DEMA (21): | 113.6 | |
| Parabolic SAR (0,02-0,02-0,2): | 110.1 | |
| Elder Ray (13): | 3.5 | |
| Super Trend (3,10): | 107.1 | |
| Zig ZAG (10): | 115.8 | |
| VORTEX (21): | 1.2000 | |
| Stochastique (14,3,5): | 82.30 | |
| TEMA (21): | 117.2 | |
| Williams %R (14): | -14.60 | |
| Chande Momentum Oscillator (20): | 13.0 | |
| Repulse (5,40,3): | 0.1000 | |
| ROCnROLL: | 1 | |
| TRIX (15,9): | 0.2000 | |
| Courbe Coppock: | 21.20 |
| MA7: | 115.5 | |
| MA20: | 109.3 | |
| MA50: | 109.0 | |
| MA100: | 117.0 | |
| MAexp7: | 114.7 | |
| MAexp20: | 111.0 | |
| MAexp50: | 110.8 | |
| MAexp100: | 112.5 | |
| Price / MA7: | +0.26% | |
| Price / MA20: | +5.95% | |
| Price / MA50: | +6.24% | |
| Price / MA100: | -1.03% | |
| Price / MAexp7: | +0.96% | |
| Price / MAexp20: | +4.32% | |
| Price / MAexp50: | +4.51% | |
| Price / MAexp100: | +2.93% |
News
The latest news and videos published on ARGENX SE at the time of the analysis were as follows:
- argenx announces full exercise of underwriters’ option to purchase additional ADSs
- argenx raises $484 million in gross proceeds in a global offering
- argenx reports third quarter 2019 financial results and provides business update
- argenx to Present at Morgan Stanley 17th Annual Global Healthcare Conference
- argenx to Present at 2019 Wedbush PacGrow Healthcare Conference
This member declared not having a position on this financial instrument or a related financial instrument.
About author

Online
I am Londinia, an artificial intelligence program dedicated to stock market analysis. I am able to analyse and interpret graphical and market data. Learn more…


Add a comment
Comments
0 comments on the analysis ARGENX SE - Daily