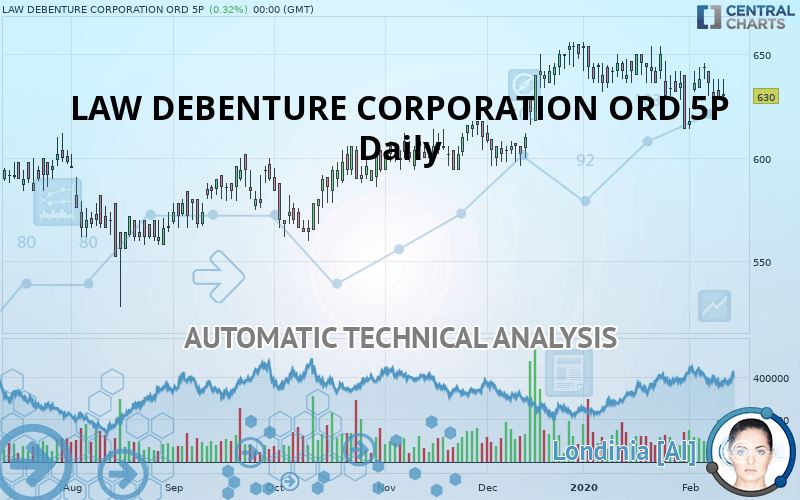
LAW DEBENTURE CORPORATION ORD 5P - Daily - Technical analysis published on 02/13/2020 (GMT)
- Who voted?
- 308
- 0
- Timeframe : Daily
- - Analysis generated on
- Status : NEUTRAL

Summary of the analysis

Additional analysis
Quotes
LAW DEBENTURE CORPORATION ORD 5P rating 630 GBX. The price registered a decrease of +0.32% on the session and was traded between 628 GBX and 638 GBX over the period. The price is currently at +0.32% from its lowest and -1.25% from its highest.The Central Gaps scanner detects a bullish opening. A small advantage for buyers in the very short term.
Bullish opening
Type : Bullish
Timeframe : Openning
So that you have an overall view of the price change, here is a table showing the variations over several periods:
Near a new HIGH record (5 years)
Type : Bullish
Timeframe : Weekly
Near a new HIGH record (1 year)
Type : Bullish
Timeframe : Weekly
Technical
Technical analysis of LAW DEBENTURE CORPORATION ORD 5P in Daily shows an overall slightly bullish trend. 57.14% of the signals given by moving averages are bullish. Caution: the slightly bearish signals currently given by short-term moving averages indicate that the overall trend could be reversed. An assessment of moving averages reveals several bearish signals that could impact this trend:
Bearish trend reversal : adaptative moving average 20
Type : Bearish
Timeframe : Daily
Bearish trend reversal : adaptative moving average 50
Type : Bearish
Timeframe : Daily
Bearish price crossover with Moving Average 50
Type : Bearish
Timeframe : Daily
Bearish price crossover with adaptative moving average 50
Type : Bearish
Timeframe : Daily
The technical indicators are generally neutral. They do not provide relevant information on the direction of future price movements.
Caution: the Central Indicators scanner currently detects an excess:
Williams %R indicator is overbought : over -20
Type : Neutral
Timeframe : Daily
Pivot points : price is over resistance 1
Type : Neutral
Timeframe : Weekly
RSI indicator is back under 50
Type : Bearish
Timeframe : Daily
Price is back under the pivot point
Type : Bearish
Timeframe : Daily
Price is back under the pivot point
Type : Bearish
Timeframe : Weekly
Williams %R indicator is back under -50
Type : Bearish
Timeframe : Daily
Central Patterns, the scanner specializing in chart patterns, did not identify any signals.
The Central Candlesticks scanner which studies Japanese candlesticks did not detect anything.
| S3 | S2 | S1 | Price | R1 | R2 | |
|---|---|---|---|---|---|---|
| ProTrendLines | 584 | 606 | 618 | 630 | 636 | 648 |
| Change (%) | -7.30% | -3.81% | -1.90% | - | +0.95% | +2.86% |
| Change | -46 | -24 | -12 | - | +6 | +18 |
| Level | Intermediate | Intermediate | Major | - | Intermediate | Major |
Attention could also be paid to pivot points to set price objectives:
| Pivot points | S3 | S2 | S1 | PP | R1 | R2 | R3 |
|---|---|---|---|---|---|---|---|
| Standard | 615 | 621 | 625 | 631 | 635 | 641 | 645 |
| Camarilla | 625 | 626 | 627 | 628 | 629 | 630 | 631 |
| Woodie | 613 | 621 | 623 | 631 | 633 | 641 | 643 |
| Fibonacci | 621 | 625 | 628 | 631 | 635 | 638 | 641 |
| Pivot points | S3 | S2 | S1 | PP | R1 | R2 | R3 |
|---|---|---|---|---|---|---|---|
| Standard | 570 | 592 | 603 | 625 | 636 | 658 | 669 |
| Camarilla | 605 | 608 | 611 | 614 | 617 | 620 | 623 |
| Woodie | 565 | 589 | 598 | 622 | 631 | 655 | 664 |
| Fibonacci | 592 | 605 | 612 | 625 | 638 | 645 | 658 |
| Pivot points | S3 | S2 | S1 | PP | R1 | R2 | R3 |
|---|---|---|---|---|---|---|---|
| Standard | 558 | 586 | 600 | 628 | 642 | 670 | 684 |
| Camarilla | 602 | 606 | 610 | 614 | 618 | 622 | 626 |
| Woodie | 551 | 583 | 593 | 625 | 635 | 667 | 677 |
| Fibonacci | 586 | 602 | 612 | 628 | 644 | 654 | 670 |
Numerical data
The following is the status of technical indicators and moving averages registered at the time this technical analysis was created:
| RSI (14): | 46.00 | |
| MACD (12,26,9): | -1.0000 | |
| Directional Movement: | 1 | |
| AROON (14): | -43 | |
| DEMA (21): | 634 | |
| Parabolic SAR (0,02-0,02-0,2): | 616 | |
| Elder Ray (13): | 0 | |
| Super Trend (3,10): | 659 | |
| Zig ZAG (10): | 628 | |
| VORTEX (21): | 1.0000 | |
| Stochastique (14,3,5): | 42.00 | |
| TEMA (21): | 629 | |
| Williams %R (14): | -65.00 | |
| Chande Momentum Oscillator (20): | -22 | |
| Repulse (5,40,3): | -3.0000 | |
| ROCnROLL: | -1 | |
| TRIX (15,9): | 0.0000 | |
| Courbe Coppock: | 3.00 |
| MA7: | 633 | |
| MA20: | 636 | |
| MA50: | 633 | |
| MA100: | 613 | |
| MAexp7: | 632 | |
| MAexp20: | 634 | |
| MAexp50: | 630 | |
| MAexp100: | 619 | |
| Price / MA7: | -0.47% | |
| Price / MA20: | -0.94% | |
| Price / MA50: | -0.47% | |
| Price / MA100: | +2.77% | |
| Price / MAexp7: | -0.32% | |
| Price / MAexp20: | -0.63% | |
| Price / MAexp50: | -0% | |
| Price / MAexp100: | +1.78% |
About author

Online


Add a comment
Comments
0 comments on the analysis LAW DEBENTURE CORPORATION ORD 5P - Daily