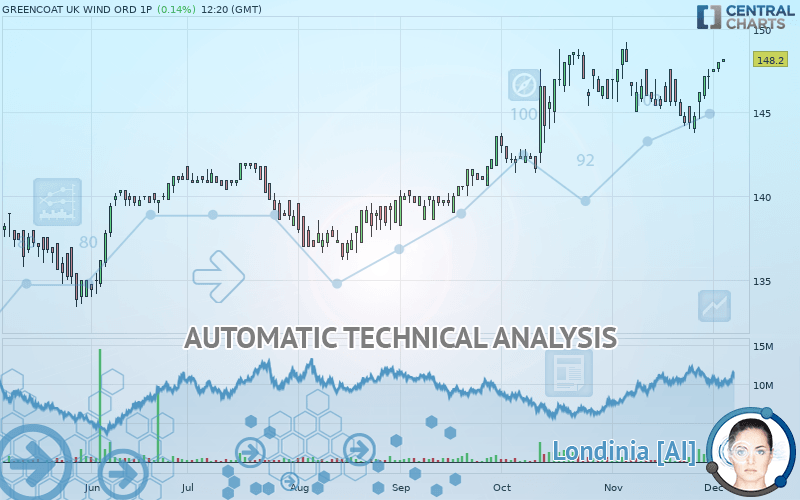
GREENCOAT UK WIND ORD 1P - Daily - Technical analysis published on 12/04/2019 (GMT)
- Who voted?
- 285
- 0
Click here for a new analysis!
- Timeframe : Daily
- - Analysis generated on
- Status : TARGET REACHED

Summary of the analysis

Additional analysis
Quotes
The GREENCOAT UK WIND ORD 1P price is 148.2 GBX. The price has increased by +0.14% since the last closing with the lowest point at 148.0 GBX and the highest point at 148.2 GBX. The deviation from the price is +0.14% for the low point and 0% for the high point.Here is a more detailed summary of the historical variations registered by GREENCOAT UK WIND ORD 1P:
New HIGH record (5 years)
Type : Bullish
Timeframe : Weekly
New HIGH record (1 year)
Type : Bullish
Timeframe : Weekly
New HIGH record (1st january)
Type : Bullish
Timeframe : Weekly
New HIGH record (1 month)
Type : Bullish
Timeframe : Weekly
Near a new LOW record (1 month)
Type : Bearish
Timeframe : Weekly
Technical
Technical analysis of this Daily chart of GREENCOAT UK WIND ORD 1P indicates that the overall trend is strongly bullish. 92.86% of the signals given by moving averages are bullish. The overall trend is supported by the strong bullish signals from short-term moving averages. The Central Indicators market scanner currently does not detect any result that concerns moving averages.
In fact, 15 technical indicators on 18 studied are currently bullish. But beware of excesses. The Central Indicators scanner currently detects this:
CCI indicator is overbought : over 100
Type : Neutral
Timeframe : Daily
Williams %R indicator is overbought : over -20
Type : Neutral
Timeframe : Daily
Price is back over the pivot point
Type : Bullish
Timeframe : Daily
Price is back over the pivot point
Type : Bullish
Timeframe : Weekly
An analysis of the price chart with the Central Patterns scanner (detector of chart patterns and resistances and supports) shows several results that can have an impact on the price change:
Near horizontal resistance
Type : Bearish
Timeframe : Daily
Resistance of channel is broken
Type : Bullish
Timeframe : Daily
The Central Candlesticks scanner, specialised in Japanese candlesticks, did not identify any signals.
| S3 | S2 | S1 | Price | R1 | |
|---|---|---|---|---|---|
| ProTrendLines | 136.4 | 142.0 | 144.4 | 148.2 | 148.7 |
| Change (%) | -7.96% | -4.18% | -2.56% | - | +0.34% |
| Change | -11.8 | -6.2 | -3.8 | - | +0.5 |
| Level | Major | Intermediate | Minor | - | Intermediate |
Pivot points can also be used to set your price objectives. Here is the price situation in relation to pivot points:
| Pivot points | S3 | S2 | S1 | PP | R1 | R2 | R3 |
|---|---|---|---|---|---|---|---|
| Standard | 147.0 | 147.2 | 147.6 | 147.8 | 148.2 | 148.4 | 148.8 |
| Camarilla | 147.8 | 147.9 | 147.9 | 148.0 | 148.1 | 148.1 | 148.2 |
| Woodie | 147.1 | 147.3 | 147.7 | 147.9 | 148.3 | 148.5 | 148.9 |
| Fibonacci | 147.2 | 147.4 | 147.6 | 147.8 | 148.0 | 148.2 | 148.4 |
| Pivot points | S3 | S2 | S1 | PP | R1 | R2 | R3 |
|---|---|---|---|---|---|---|---|
| Standard | 141.0 | 142.4 | 144.8 | 146.2 | 148.6 | 150.0 | 152.4 |
| Camarilla | 146.2 | 146.5 | 146.9 | 147.2 | 147.6 | 147.9 | 148.2 |
| Woodie | 141.5 | 142.7 | 145.3 | 146.5 | 149.1 | 150.3 | 152.9 |
| Fibonacci | 142.4 | 143.9 | 144.8 | 146.2 | 147.7 | 148.6 | 150.0 |
Numerical data
The following are the details of the technical indicators and moving averages that were collected to generate this technical analysis:
| RSI (14): | 67.70 | |
| MACD (12,26,9): | 0.8000 | |
| Directional Movement: | 20.3 | |
| AROON (14): | 42.9 | |
| DEMA (21): | 147.2 | |
| Parabolic SAR (0,02-0,02-0,2): | 144.4 | |
| Elder Ray (13): | 1.4 | |
| Super Trend (3,10): | 144.8 | |
| Zig ZAG (10): | 148.0 | |
| VORTEX (21): | 1.1000 | |
| Stochastique (14,3,5): | 100.00 | |
| TEMA (21): | 147.2 | |
| Williams %R (14): | 0.00 | |
| Chande Momentum Oscillator (20): | 2.4 | |
| Repulse (5,40,3): | 0.7000 | |
| ROCnROLL: | 1 | |
| TRIX (15,9): | 0.1000 | |
| Courbe Coppock: | 1.50 |
| MA7: | 147.0 | |
| MA20: | 146.1 | |
| MA50: | 144.6 | |
| MA100: | 140.8 | |
| MAexp7: | 147.1 | |
| MAexp20: | 146.2 | |
| MAexp50: | 144.4 | |
| MAexp100: | 141.7 | |
| Price / MA7: | +0.82% | |
| Price / MA20: | +1.44% | |
| Price / MA50: | +2.49% | |
| Price / MA100: | +5.26% | |
| Price / MAexp7: | +0.75% | |
| Price / MAexp20: | +1.37% | |
| Price / MAexp50: | +2.63% | |
| Price / MAexp100: | +4.59% |
News
The last news published on GREENCOAT UK WIND ORD 1P at the time of the generation of this analysis was as follows:
-
 Greencoat UK Wind close to powering 1 mln UK homes as size of portfolio surges
-
Greencoat UK Wind delivers strong return buoyed by acquisitions
-
Greencoat UK Wind to acquire Tom nan Clach wind farm in Scotland
-
Greencoat UK Wind enjoys 'continued solid performance' across portfolio
-
Greencoat UK Wind now powering a city the size of Birmingham
About author

Online


Add a comment
Comments
0 comments on the analysis GREENCOAT UK WIND ORD 1P - Daily