ADTRAN HOLDINGS INC. - Daily - Technical analysis published on 08/28/2019 (GMT)
- Who voted?
- 298
- 0
Click here for a new analysis!
- Timeframe : Daily
- - Analysis generated on
- Status : INVALID

Summary of the analysis

Additional analysis
Quotes
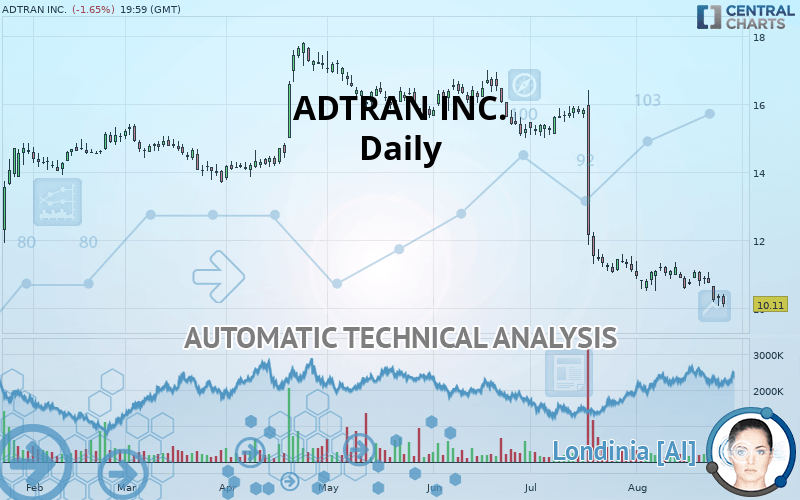
The ADTRAN INC. rating is 10.11 USD. On the day, this instrument lost -1.65% and was between 10.03 USD and 10.40 USD. This implies that the price is at +0.80% from its lowest and at -2.79% from its highest.A bullish opening was detected by the Central Gaps scanner. Buyers are trying to impose a bullish momentum in the very short term.
Bullish opening
Type : Bullish
Timeframe : Openning
Here is a more detailed summary of the historical variations registered by ADTRAN INC.:
New LOW record (5 years)
Type : Bearish
Timeframe : Weekly
New LOW record (1 year)
Type : Bearish
Timeframe : Weekly
New LOW record (1st january)
Type : Bearish
Timeframe : Weekly
New LOW record (1 month)
Type : Bearish
Timeframe : Weekly
Technical
Technical analysis of this Daily chart of ADTRAN INC. indicates that the overall trend is strongly bearish. 92.86% of the signals given by moving averages are bearish. The overall trend is supported by the strong bearish signals from short-term moving averages. The Central Indicators scanner does not detect any result on moving averages that would impact this trend.
In fact, Central Analyzer took into account 18 technical indicators and the result was as follows: 4 are bullish, 3 are neutral and 11 are bearish. Caution: the Central Indicators scanner currently detects an excess:
RSI indicator is oversold : under 30
Type : Neutral
Timeframe : Daily
CCI indicator is oversold : under -100
Type : Neutral
Timeframe : Daily
Previous candle closed under Bollinger bands
Type : Neutral
Timeframe : Daily
RSI indicator: bullish divergence
Type : Bullish
Timeframe : Daily
Williams %R indicator is oversold : under -80
Type : Neutral
Timeframe : Daily
Price is back under the pivot point
Type : Bearish
Timeframe : Weekly
No signals are given by Central Patterns, a market scanner specialised in chart patterns, resistances and supports.
No result was found by the Central Candlesticks scanner on Japanese candlesticks.
| Price | R1 | R2 | R3 | |
|---|---|---|---|---|
| ProTrendLines | 10.11 | 10.43 | 11.06 | 13.95 |
| Change (%) | - | +3.17% | +9.40% | +37.98% |
| Change | - | +0.32 | +0.95 | +3.84 |
| Level | - | Major | Intermediate | Intermediate |
Attention could also be paid to pivot points to set price objectives:
| Pivot points | S3 | S2 | S1 | PP | R1 | R2 | R3 |
|---|---|---|---|---|---|---|---|
| Standard | 9.75 | 9.91 | 10.09 | 10.26 | 10.44 | 10.60 | 10.79 |
| Camarilla | 10.19 | 10.22 | 10.25 | 10.28 | 10.31 | 10.34 | 10.38 |
| Woodie | 9.76 | 9.92 | 10.11 | 10.26 | 10.45 | 10.61 | 10.80 |
| Fibonacci | 9.91 | 10.04 | 10.12 | 10.26 | 10.39 | 10.47 | 10.60 |
| Pivot points | S3 | S2 | S1 | PP | R1 | R2 | R3 |
|---|---|---|---|---|---|---|---|
| Standard | 8.97 | 9.57 | 9.91 | 10.51 | 10.85 | 11.45 | 11.79 |
| Camarilla | 9.99 | 10.08 | 10.16 | 10.25 | 10.34 | 10.42 | 10.51 |
| Woodie | 8.84 | 9.51 | 9.78 | 10.45 | 10.72 | 11.39 | 11.66 |
| Fibonacci | 9.57 | 9.93 | 10.15 | 10.51 | 10.87 | 11.09 | 11.45 |
| Pivot points | S3 | S2 | S1 | PP | R1 | R2 | R3 |
|---|---|---|---|---|---|---|---|
| Standard | 3.92 | 7.48 | 9.29 | 12.85 | 14.66 | 18.22 | 20.03 |
| Camarilla | 9.63 | 10.13 | 10.62 | 11.11 | 11.60 | 12.09 | 12.59 |
| Woodie | 3.06 | 7.04 | 8.43 | 12.41 | 13.80 | 17.78 | 19.17 |
| Fibonacci | 7.48 | 9.53 | 10.80 | 12.85 | 14.90 | 16.17 | 18.22 |
Numerical data
The following is the status of technical indicators and moving averages registered at the time this technical analysis was created:
| RSI (14): | 26.78 | |
| MACD (12,26,9): | -0.6700 | |
| Directional Movement: | -24.53 | |
| AROON (14): | -71.43 | |
| DEMA (21): | 10.05 | |
| Parabolic SAR (0,02-0,02-0,2): | 11.29 | |
| Elder Ray (13): | -0.49 | |
| Super Trend (3,10): | 11.39 | |
| Zig ZAG (10): | 10.11 | |
| VORTEX (21): | 0.7800 | |
| Stochastique (14,3,5): | 9.67 | |
| TEMA (21): | 10.19 | |
| Williams %R (14): | -93.98 | |
| Chande Momentum Oscillator (20): | -0.92 | |
| Repulse (5,40,3): | -6.2600 | |
| ROCnROLL: | 2 | |
| TRIX (15,9): | -0.9100 | |
| Courbe Coppock: | 9.43 |
| MA7: | 10.58 | |
| MA20: | 10.83 | |
| MA50: | 12.97 | |
| MA100: | 14.55 | |
| MAexp7: | 10.47 | |
| MAexp20: | 11.02 | |
| MAexp50: | 12.43 | |
| MAexp100: | 13.51 | |
| Price / MA7: | -4.44% | |
| Price / MA20: | -6.65% | |
| Price / MA50: | -22.05% | |
| Price / MA100: | -30.52% | |
| Price / MAexp7: | -3.44% | |
| Price / MAexp20: | -8.26% | |
| Price / MAexp50: | -18.66% | |
| Price / MAexp100: | -25.17% |
News
Don"t forget to follow the news on ADTRAN INC.. At the time of publication of this analysis, the latest news was as follows:
- ADTRAN Powers Innovative Utility Application
- Bragar Eagel & Squire, P.C. is Investigating ADTRAN, Inc. (NASDAQ: ADTN) on Behalf of Stockholders and Encourages ADTRAN Investors to Contact the Firm
- Bragar Eagel & Squire, P.C. is Investigating ADTRAN, Inc. (NASDAQ: ADTN) on Behalf of Stockholders and Encourages ADTRAN Investors to Contact the Firm
- Hagens Berman Investigating ADTRAN (ADTN) Inventory Accounting, Investors With Losses Should Contact Firm
- SmartRG Upgrades Wi-Fi Mess to Mesh with Intellifi Carrier-Grade Whole Home Wi-Fi Solution
About author

Online


Add a comment
Comments
0 comments on the analysis ADTRAN HOLDINGS INC. - Daily