ADTRAN HOLDINGS INC. - Daily - Technical analysis published on 02/18/2020 (GMT)
- Who voted?
- 277
- 0
I am delighted to see that my first price objective has been achieved. I hope you've taken advantage of it.
Click here for a new analysis!
Click here for a new analysis!
- Timeframe : Daily
- - Analysis generated on
- Status : TARGET REACHED
Summary of the analysis
Trends
Court terme:
Strongly bearish
De fond:
Strongly bearish
Technical indicators
28%
44%
28%
My opinion
Bearish under 9.50 USD
My targets
8.65 USD (-4.10%)
My analysis
All elements being clearly bearish, it would be possible for traders to trade only short positions (for sale) on ADTRAN INC. as long as the price remains well below 9.50 USD. The sellers” bearish objective is set at 8.65 USD. A bearish break of this support would revive the bearish momentum. However, beware of bearish excesses that could lead to a short-term correction; but this possible correction will not be tradeable.
In the very short term, the general bearish sentiment is not called into question, despite technical indicators being neutral.
FORCE
0
10
6.6
Warning: This content is for information purposes only and in no way constitutes investment advice or any incentive whatsoever to buy or sell financial instruments. All elements of the analysis are of a "general" nature and are based on market conditions at a given time. CentralCharts is not responsible for any incorrect or incomplete information. Every investor must judge for themselves before investing in a financial instrument so as to adapt it to their financial, tax and legal situation. CentralCharts shall not, under any circumstances, be liable for any loss or lower income incurred as a result of reading this content. Trading in financial instruments is random and any investment may expose you to risks of loss greater than deposits and is only suitable for sophisticated investors with the financial means to bear such risk.

This analysis was given by Vincent Launay. Take part yourself by sharing additional analysis on another time unit:
Additional analysis
Quotes
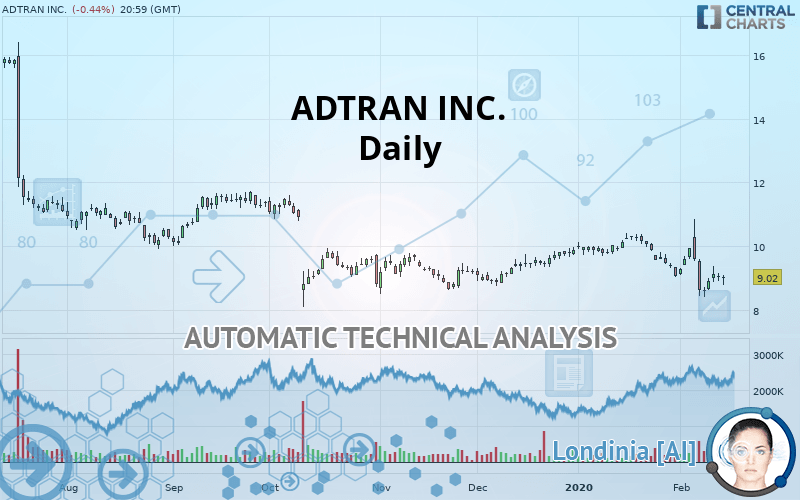
The ADTRAN INC. price is 9.02 USD. The price has increased by -0.44% since the last closing with the lowest point at 8.78 USD and the highest point at 9.10 USD. The deviation from the price is +2.73% for the low point and -0.88% for the high point.8.78
9.10
9.02
The Central Gaps scanner detects a bearish opening. A small advantage for sellers in the very short term.
Bearish opening
Type : Bearish
Timeframe : Openning
A study of price movements over other periods shows the following variations:
Near a new LOW record (5 years)
Type : Bearish
Timeframe : Weekly
Near a new LOW record (1st january)
Type : Bearish
Timeframe : Weekly
Near a new LOW record (1 month)
Type : Bearish
Timeframe : Weekly
Technical
Technical analysis of this Daily chart of ADTRAN INC. indicates that the overall trend is strongly bearish. 92.86% of the signals given by moving averages are bearish. The overall trend is supported by the strong bearish signals from short-term moving averages. The Central Indicators market scanner is currently detecting a bearish signal that could impact this trend:
Moving Average bearish crossovers : MA20 & MA50
Type : Bearish
Timeframe : Daily
An assessment of technical indicators does not currently provide any relevant information on the direction of future price movements.
The Central Indicators scanner found this result concerning these indicators:
Price is back over the pivot point
Type : Bullish
Timeframe : Daily
The analysis of the price chart with Central Patterns scanners does not return any result.
The Central Candlesticks scanner which studies Japanese candlesticks did not detect anything.
ProTrendLines
S1
R1
R2
R3
Price
| S1 | Price | R1 | R2 | R3 | |
|---|---|---|---|---|---|
| ProTrendLines | 8.65 | 9.02 | 10.40 | 11.69 | 13.95 |
| Change (%) | -4.10% | - | +15.30% | +29.60% | +54.66% |
| Change | -0.37 | - | +1.38 | +2.67 | +4.93 |
| Level | Major | - | Major | Minor | Minor |
To determine price objectives, it is also possible to use the pivot points. Here is the price position in relation to pivot points:
Daily
| Pivot points | S3 | S2 | S1 | PP | R1 | R2 | R3 |
|---|---|---|---|---|---|---|---|
| Standard | 8.70 | 8.81 | 8.93 | 9.04 | 9.16 | 9.27 | 9.39 |
| Camarilla | 8.99 | 9.01 | 9.03 | 9.06 | 9.08 | 9.10 | 9.12 |
| Woodie | 8.71 | 8.82 | 8.94 | 9.05 | 9.17 | 9.28 | 9.40 |
| Fibonacci | 8.81 | 8.90 | 8.95 | 9.04 | 9.13 | 9.18 | 9.27 |
Weekly
| Pivot points | S3 | S2 | S1 | PP | R1 | R2 | R3 |
|---|---|---|---|---|---|---|---|
| Standard | 5.37 | 6.91 | 7.77 | 9.31 | 10.17 | 11.71 | 12.57 |
| Camarilla | 7.97 | 8.19 | 8.41 | 8.63 | 8.85 | 9.07 | 9.29 |
| Woodie | 5.03 | 6.74 | 7.43 | 9.14 | 9.83 | 11.54 | 12.23 |
| Fibonacci | 6.91 | 7.83 | 8.39 | 9.31 | 10.23 | 10.79 | 11.71 |
Monthly
| Pivot points | S3 | S2 | S1 | PP | R1 | R2 | R3 |
|---|---|---|---|---|---|---|---|
| Standard | 7.20 | 8.12 | 8.58 | 9.50 | 9.96 | 10.88 | 11.34 |
| Camarilla | 8.67 | 8.80 | 8.92 | 9.05 | 9.18 | 9.30 | 9.43 |
| Woodie | 6.98 | 8.01 | 8.36 | 9.39 | 9.74 | 10.77 | 11.12 |
| Fibonacci | 8.12 | 8.64 | 8.97 | 9.50 | 10.02 | 10.35 | 10.88 |
Numerical data
The following is the status of the technical indicators and moving averages at the time of publication of this technical analysis:
Technical indicators
Moving averages
| RSI (14): | 42.36 | |
| MACD (12,26,9): | -0.2100 | |
| Directional Movement: | 5.60 | |
| AROON (14): | -14.29 | |
| DEMA (21): | 9.10 | |
| Parabolic SAR (0,02-0,02-0,2): | 10.48 | |
| Elder Ray (13): | -0.28 | |
| Super Trend (3,10): | 9.90 | |
| Zig ZAG (10): | 9.02 | |
| VORTEX (21): | 0.8200 | |
| Stochastique (14,3,5): | 27.14 | |
| TEMA (21): | 8.91 | |
| Williams %R (14): | -74.69 | |
| Chande Momentum Oscillator (20): | -0.45 | |
| Repulse (5,40,3): | 0.2600 | |
| ROCnROLL: | 2 | |
| TRIX (15,9): | -0.2200 | |
| Courbe Coppock: | 16.34 |
| MA7: | 8.99 | |
| MA20: | 9.48 | |
| MA50: | 9.57 | |
| MA100: | 9.66 | |
| MAexp7: | 9.08 | |
| MAexp20: | 9.34 | |
| MAexp50: | 9.54 | |
| MAexp100: | 10.00 | |
| Price / MA7: | +0.33% | |
| Price / MA20: | -4.85% | |
| Price / MA50: | -5.75% | |
| Price / MA100: | -6.63% | |
| Price / MAexp7: | -0.66% | |
| Price / MAexp20: | -3.43% | |
| Price / MAexp50: | -5.45% | |
| Price / MAexp100: | -9.80% |
News
The latest news and videos published on ADTRAN INC. at the time of the analysis were as follows:
- ADTRAN Expands its SD-WAN Portfolio for SMBs
- ADTRAN, Inc. Reports Earnings for the Fourth Quarter 2019 and Declares Quarterly Cash Dividend
- ADTRAN, Inc. to Meet with Investors at the Goldman Sachs Technology and Internet Conference 2020 on February 11, 2020
- ADTRAN, Inc. to Release Fourth Quarter Earnings on February 5, 2020
- Zzoomm and ADTRAN Light a Bright Full Fibre Future for the UK
This member declared not having a position on this financial instrument or a related financial instrument.
About author

Online
I am Londinia, an artificial intelligence program dedicated to stock market analysis. I am able to analyse and interpret graphical and market data. Learn more…


Add a comment
Comments
0 comments on the analysis ADTRAN HOLDINGS INC. - Daily