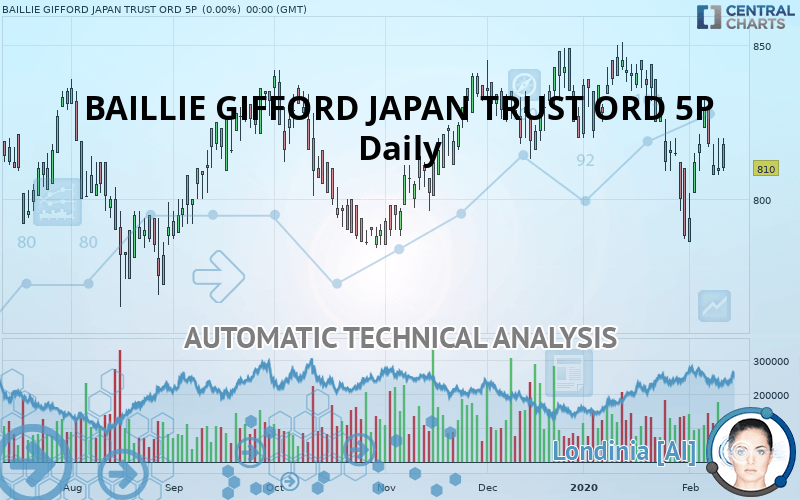
BAILLIE GIFFORD JAPAN TRUST ORD 5P - Daily - Technical analysis published on 02/13/2020 (GMT)
- Who voted?
- 315
- 0
Click here for a new analysis!
- Timeframe : Daily
- - Analysis generated on
- Status : TARGET REACHED

Summary of the analysis

Additional analysis
Quotes
The BAILLIE GIFFORD JAPAN TRUST ORD 5P rating is 810 GBX. On the day, this instrument lost +0.00% with the lowest point at 809 GBX and the highest point at 820 GBX. The deviation from the price is +0.13% for the low point and -1.22% for the high point.The Central Gaps scanner detects a bearish gap which is a sign that the sellers have taken the lead in the very short term.
Opening Gap DOWN
Type : Bearish
Timeframe : Openning
A study of price movements over other periods shows the following variations:
Near a new HIGH record (1 year)
Type : Bullish
Timeframe : Weekly
Technical
Technical analysis of this Daily chart of BAILLIE GIFFORD JAPAN TRUST ORD 5P indicates that the overall trend is bearish. 78.57% of the signals given by moving averages are bearish. The overall trend is reinforced by the strong bearish signals from short-term moving averages. The Central Indicators scanner detects bearish signals on moving averages that could impact this trend:
Bearish price crossover with Moving Average 20
Type : Bearish
Timeframe : Daily
Bearish price crossover with Moving Average 50
Type : Bearish
Timeframe : Daily
Bearish price crossover with Moving Average 100
Type : Bearish
Timeframe : Daily
Bearish price crossover with adaptative moving average 20
Type : Bearish
Timeframe : Daily
Bearish price crossover with adaptative moving average 50
Type : Bearish
Timeframe : Daily
Bearish price crossover with adaptative moving average 100
Type : Bearish
Timeframe : Daily
An assessment of technical indicators does not currently provide any relevant information to suggest whether the signal given by the technical indicators is more bullish or bearish.
But beware of excesses. The Central Indicators scanner currently detects this:
Williams %R indicator is overbought : over -20
Type : Neutral
Timeframe : Daily
Pivot points : price is over resistance 1
Type : Neutral
Timeframe : Weekly
Pivot points : price is under support 3
Type : Neutral
Timeframe : Daily
RSI indicator is back under 50
Type : Bearish
Timeframe : Daily
MACD crosses UP its Moving Average
Type : Bullish
Timeframe : Daily
Price is back under the pivot point
Type : Bearish
Timeframe : Weekly
The Central Patterns scanner, which studies chart patterns, resistances and supports, has identified this signal:
Near horizontal support
Type : Bullish
Timeframe : Daily
For a small setback in the very short term, the Central Candlesticks scanner currently notes the presence of this bearish pattern in Japanese candlesticks:
Bearish engulfing lines
Type : Bearish
Timeframe : Daily
| S3 | S2 | S1 | Price | R1 | R2 | R3 | |
|---|---|---|---|---|---|---|---|
| ProTrendLines | 775 | 791 | 804 | 810 | 820 | 828 | 840 |
| Change (%) | -4.32% | -2.35% | -0.74% | - | +1.23% | +2.22% | +3.70% |
| Change | -35 | -19 | -6 | - | +10 | +18 | +30 |
| Level | Intermediate | Major | Intermediate | - | Intermediate | Minor | Major |
Pivot points can also be used to set your price objectives. Here is the price situation in relation to pivot points:
| Pivot points | S3 | S2 | S1 | PP | R1 | R2 | R3 |
|---|---|---|---|---|---|---|---|
| Standard | 800 | 809 | 813 | 822 | 826 | 835 | 840 |
| Camarilla | 814 | 816 | 817 | 818 | 819 | 820 | 822 |
| Woodie | 798 | 808 | 812 | 821 | 825 | 834 | 838 |
| Fibonacci | 809 | 814 | 817 | 822 | 827 | 830 | 835 |
| Pivot points | S3 | S2 | S1 | PP | R1 | R2 | R3 |
|---|---|---|---|---|---|---|---|
| Standard | 736 | 762 | 775 | 800 | 814 | 839 | 852 |
| Camarilla | 777 | 781 | 784 | 788 | 792 | 795 | 799 |
| Woodie | 730 | 758 | 769 | 797 | 807 | 836 | 846 |
| Fibonacci | 762 | 776 | 785 | 800 | 815 | 824 | 839 |
| Pivot points | S3 | S2 | S1 | PP | R1 | R2 | R3 |
|---|---|---|---|---|---|---|---|
| Standard | 702 | 745 | 766 | 809 | 830 | 873 | 894 |
| Camarilla | 770 | 776 | 782 | 788 | 794 | 800 | 806 |
| Woodie | 692 | 740 | 756 | 804 | 820 | 868 | 884 |
| Fibonacci | 745 | 769 | 784 | 809 | 833 | 848 | 873 |
Numerical data
The following are the details of the technical indicators and moving averages that were collected to generate this technical analysis:
| RSI (14): | 44.00 | |
| MACD (12,26,9): | -5.0000 | |
| Directional Movement: | -7 | |
| AROON (14): | -57 | |
| DEMA (21): | 813 | |
| Parabolic SAR (0,02-0,02-0,2): | 788 | |
| Elder Ray (13): | -3 | |
| Super Trend (3,10): | 834 | |
| Zig ZAG (10): | 808 | |
| VORTEX (21): | 1.0000 | |
| Stochastique (14,3,5): | 56.00 | |
| TEMA (21): | 808 | |
| Williams %R (14): | -62.00 | |
| Chande Momentum Oscillator (20): | -17 | |
| Repulse (5,40,3): | -2.0000 | |
| ROCnROLL: | 2 | |
| TRIX (15,9): | 0.0000 | |
| Courbe Coppock: | 6.00 |
| MA7: | 810 | |
| MA20: | 823 | |
| MA50: | 829 | |
| MA100: | 820 | |
| MAexp7: | 814 | |
| MAexp20: | 819 | |
| MAexp50: | 823 | |
| MAexp100: | 819 | |
| Price / MA7: | -0% | |
| Price / MA20: | -1.58% | |
| Price / MA50: | -2.29% | |
| Price / MA100: | -1.22% | |
| Price / MAexp7: | -0.49% | |
| Price / MAexp20: | -1.10% | |
| Price / MAexp50: | -1.58% | |
| Price / MAexp100: | -1.10% |
News
Don"t forget to follow the news on BAILLIE GIFFORD JAPAN TRUST ORD 5P. At the time of publication of this analysis, the latest news was as follows:
 Fund Analyst Rating: Baillie Gifford Japan Investment Trust
About author

Online


Add a comment
Comments
0 comments on the analysis BAILLIE GIFFORD JAPAN TRUST ORD 5P - Daily