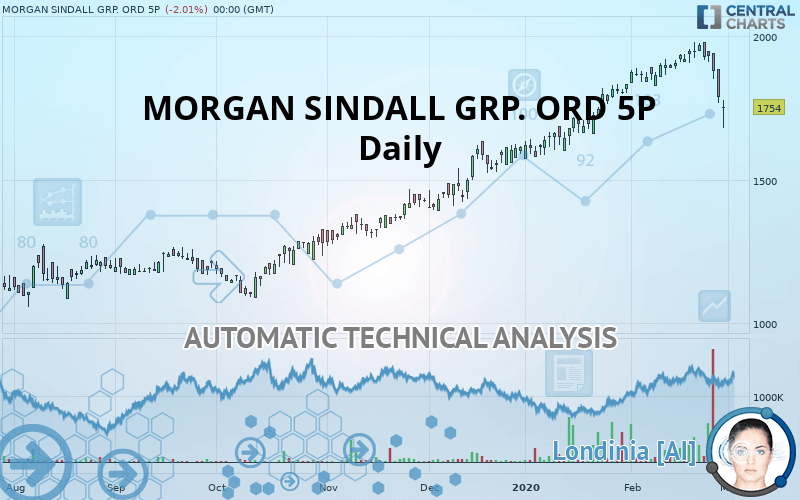
MORGAN SINDALL GRP. ORD 5P - Daily - Technical analysis published on 03/02/2020 (GMT)
- Who voted?
- 381
- 0
Click here for a new analysis!
- Timeframe : Daily
- - Analysis generated on
- Status : TARGET REACHED

Summary of the analysis

Additional analysis
Quotes
MORGAN SINDALL GRP. ORD 5P rating 1,754 GBX. The price is lower by -2.01% since the last closing and was between 1,682 GBX and 1,778 GBX. This implies that the price is at +4.28% from its lowest and at -1.35% from its highest.The Central Gaps scanner detects a bullish opening marking the presence of buyers ahead of sellers at the opening but not sufficiently marked to allow the price to register a quotation gap.
Bullish opening
Type : Bullish
Timeframe : Openning
Here is a more detailed summary of the historical variations registered by MORGAN SINDALL GRP. ORD 5P:
New HIGH record (5 years)
Type : Bullish
Timeframe : Weekly
Near a new HIGH record (1 year)
Type : Bullish
Timeframe : Weekly
Near a new HIGH record (1st january)
Type : Bullish
Timeframe : Weekly
Near a new HIGH record (1 month)
Type : Bullish
Timeframe : Weekly
The Central Volumes scanner detects abnormal volumes on the asset:
Abnormal volumes
Timeframe : 5 days
Abnormal volumes
Timeframe : 20 days
Abnormal volumes
Timeframe : 50 days
Technical
Technical analysis of this Daily chart of MORGAN SINDALL GRP. ORD 5P indicates that the overall trend is bullish. The signals given by moving averages are 71.43% bullish. This bullish trend could slow down given the neutral signals currently being given by short-term moving averages. An assessment of moving averages reveals several bearish signals that could impact this trend:
Bearish price crossover with Moving Average 20
Type : Bearish
Timeframe : Daily
Bearish price crossover with adaptative moving average 20
Type : Bearish
Timeframe : Daily
Bearish price crossover with adaptative moving average 50
Type : Bearish
Timeframe : Daily
In fact, Central Analyzer took into account 18 technical indicators and the result was as follows: 5 are bullish, 8 are neutral and 5 are bearish. Central Indicators, the scanner specialised in technical indicators, has identified these signals:
Pivot points : price is over resistance 1
Type : Neutral
Timeframe : Weekly
Pivot points : price is under support 3
Type : Neutral
Timeframe : Daily
Parabolic SAR indicator bearish reversal
Type : Bearish
Timeframe : Daily
Williams %R indicator is back under -50
Type : Bearish
Timeframe : Daily
The analysis of the price chart with Central Patterns scanners does not return any result.
The Central Candlesticks scanner which studies Japanese candlesticks did not detect anything.
| S3 | S2 | S1 | Price | R1 | R2 | R3 | |
|---|---|---|---|---|---|---|---|
| ProTrendLines | 1,341 | 1,540 | 1,613 | 1,754 | 1,770 | 1,858 | 1,970 |
| Change (%) | -23.55% | -12.20% | -8.04% | - | +0.91% | +5.93% | +12.31% |
| Change | -413 | -214 | -141 | - | +16 | +104 | +216 |
| Level | Major | Major | Minor | - | Intermediate | Intermediate | Major |
To determine price objectives, it is also possible to use the pivot points. Here is the price position in relation to pivot points:
| Pivot points | S3 | S2 | S1 | PP | R1 | R2 | R3 |
|---|---|---|---|---|---|---|---|
| Standard | 1,873 | 1,893 | 1,911 | 1,931 | 1,949 | 1,969 | 1,987 |
| Camarilla | 1,920 | 1,923 | 1,927 | 1,930 | 1,934 | 1,937 | 1,940 |
| Woodie | 1,873 | 1,893 | 1,911 | 1,931 | 1,949 | 1,969 | 1,987 |
| Fibonacci | 1,893 | 1,907 | 1,916 | 1,931 | 1,945 | 1,954 | 1,969 |
| Pivot points | S3 | S2 | S1 | PP | R1 | R2 | R3 |
|---|---|---|---|---|---|---|---|
| Standard | 1,755 | 1,791 | 1,849 | 1,885 | 1,943 | 1,979 | 2,037 |
| Camarilla | 1,882 | 1,891 | 1,899 | 1,908 | 1,917 | 1,925 | 1,934 |
| Woodie | 1,767 | 1,797 | 1,861 | 1,891 | 1,955 | 1,985 | 2,049 |
| Fibonacci | 1,791 | 1,827 | 1,849 | 1,885 | 1,921 | 1,943 | 1,979 |
| Pivot points | S3 | S2 | S1 | PP | R1 | R2 | R3 |
|---|---|---|---|---|---|---|---|
| Standard | 1,396 | 1,484 | 1,658 | 1,746 | 1,920 | 2,008 | 2,182 |
| Camarilla | 1,760 | 1,784 | 1,808 | 1,832 | 1,856 | 1,880 | 1,904 |
| Woodie | 1,440 | 1,506 | 1,701 | 1,767 | 1,963 | 2,029 | 2,225 |
| Fibonacci | 1,484 | 1,584 | 1,646 | 1,746 | 1,846 | 1,908 | 2,008 |
Numerical data
The following is the status of technical indicators and moving averages registered at the time this technical analysis was created:
| RSI (14): | 55.00 | |
| MACD (12,26,9): | 53.0000 | |
| Directional Movement: | 4 | |
| AROON (14): | 72 | |
| DEMA (21): | 1,958 | |
| Parabolic SAR (0,02-0,02-0,2): | 1,980 | |
| Elder Ray (13): | -12 | |
| Super Trend (3,10): | 1,841 | |
| Zig ZAG (10): | 1,880 | |
| VORTEX (21): | 1.0000 | |
| Stochastique (14,3,5): | 56.00 | |
| TEMA (21): | 1,947 | |
| Williams %R (14): | -65.00 | |
| Chande Momentum Oscillator (20): | 16 | |
| Repulse (5,40,3): | -5.0000 | |
| ROCnROLL: | -1 | |
| TRIX (15,9): | 1.0000 | |
| Courbe Coppock: | 8.00 |
| MA7: | 1,930 | |
| MA20: | 1,894 | |
| MA50: | 1,752 | |
| MA100: | 1,538 | |
| MAexp7: | 1,918 | |
| MAexp20: | 1,882 | |
| MAexp50: | 1,758 | |
| MAexp100: | 1,608 | |
| Price / MA7: | -9.12% | |
| Price / MA20: | -7.39% | |
| Price / MA50: | +0.11% | |
| Price / MA100: | +14.04% | |
| Price / MAexp7: | -8.55% | |
| Price / MAexp20: | -6.80% | |
| Price / MAexp50: | -0.23% | |
| Price / MAexp100: | +9.08% |
News
The last news published on MORGAN SINDALL GRP. ORD 5P at the time of the generation of this analysis was as follows:
-
 AIM stock picks: Beximco Pharma, Morgan Sindall, Defenx and Victoria.
-
Morgan Sindall Group
-
Morgan Sindall Group
About author

Online


Add a comment
Comments
0 comments on the analysis MORGAN SINDALL GRP. ORD 5P - Daily