GCP STUDENT LIVING ORD 1P - Daily - Technical analysis published on 02/17/2020 (GMT)
- Who voted?
- 369
- 0
Click here for a new analysis!
- Timeframe : Daily
- - Analysis generated on
- Status : TARGET REACHED
Summary of the analysis
Additional analysis
Quotes
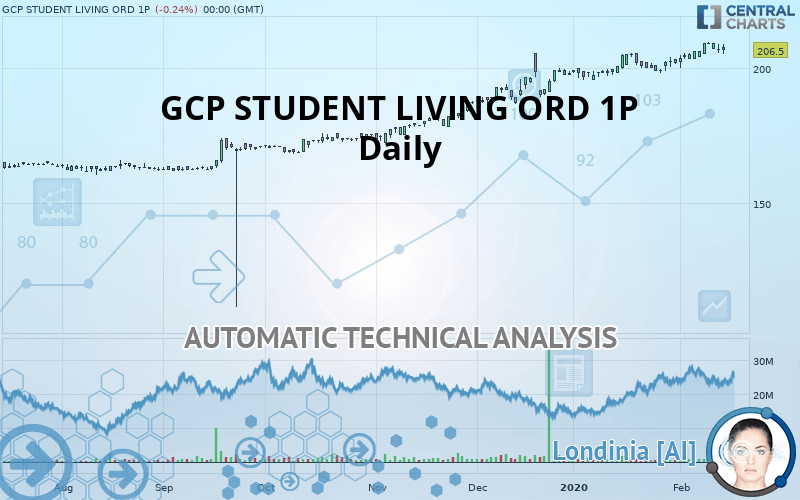
GCP STUDENT LIVING ORD 1P rating 206.5 GBX. The price is lower by -0.24% since the last closing and was between 205.0 GBX and 208.5 GBX. This implies that the price is at +0.73% from its lowest and at -0.96% from its highest.The Central Gaps scanner detects the formation of a bearish gap marking the strong presence of sellers ahead of buyers at the opening. This formed a quotation gap.
Opening Gap DOWN
Type : Bearish
Timeframe : Openning
A study of price movements over other periods shows the following variations:
New HIGH record (5 years)
Type : Bullish
Timeframe : Weekly
Near a new HIGH record (1 year)
Type : Bullish
Timeframe : Weekly
Near a new HIGH record (1st january)
Type : Bullish
Timeframe : Weekly
Near a new HIGH record (1 month)
Type : Bullish
Timeframe : Weekly
Technical
Technical analysis of this Daily chart of GCP STUDENT LIVING ORD 1P indicates that the overall trend is strongly bullish. 92.86% of the signals given by moving averages are bullish. The overall trend is supported by the strong bullish signals from short-term moving averages. The Central Indicators scanner detects a bearish signal on moving averages that could impact this trend:
Moving Average bearish crossovers : AMA50 & AMA100
Type : Bearish
Timeframe : Daily
In fact, 13 technical indicators on 18 studied are currently bullish. Caution: the Central Indicators scanner currently detects an excess:
RSI indicator is overbought : over 70
Type : Neutral
Timeframe : Daily
CCI indicator is overbought : over 100
Type : Neutral
Timeframe : Daily
Previous candle closed over Bollinger bands
Type : Neutral
Timeframe : Daily
Williams %R indicator is overbought : over -20
Type : Neutral
Timeframe : Daily
Pivot points : price is over resistance 1
Type : Neutral
Timeframe : Weekly
No signals are given by Central Patterns, a market scanner specialised in chart patterns, resistances and supports.
There is also a Japanese candlestick pattern detected by Central Candlesticks that could mark the end of the current short-term trend:
Doji
Type : Neutral
Timeframe : Daily
| S3 | S2 | S1 | Price | R1 | |
|---|---|---|---|---|---|
| ProTrendLines | 173.5 | 187.0 | 198.5 | 206.5 | 209.0 |
| Change (%) | -15.98% | -9.44% | -3.87% | - | +1.21% |
| Change | -33.0 | -19.5 | -8.0 | - | +2.5 |
| Level | Minor | Minor | Intermediate | - | Major |
Pivot points can also be used to set your price objectives. Here is the price situation in relation to pivot points:
| Pivot points | S3 | S2 | S1 | PP | R1 | R2 | R3 |
|---|---|---|---|---|---|---|---|
| Standard | 207.6 | 208.0 | 208.5 | 209.0 | 209.5 | 209.9 | 210.4 |
| Camarilla | 208.7 | 208.8 | 208.9 | 209.0 | 209.1 | 209.2 | 209.3 |
| Woodie | 207.6 | 208.1 | 208.5 | 209.0 | 209.5 | 209.9 | 210.4 |
| Fibonacci | 208.0 | 208.4 | 208.6 | 209.0 | 209.3 | 209.6 | 209.9 |
| Pivot points | S3 | S2 | S1 | PP | R1 | R2 | R3 |
|---|---|---|---|---|---|---|---|
| Standard | 192.3 | 195.2 | 198.3 | 201.2 | 204.3 | 207.2 | 210.3 |
| Camarilla | 199.9 | 200.4 | 201.0 | 201.5 | 202.1 | 202.6 | 203.2 |
| Woodie | 192.5 | 195.3 | 198.5 | 201.3 | 204.5 | 207.3 | 210.5 |
| Fibonacci | 195.2 | 197.5 | 198.9 | 201.2 | 203.5 | 204.9 | 207.2 |
| Pivot points | S3 | S2 | S1 | PP | R1 | R2 | R3 |
|---|---|---|---|---|---|---|---|
| Standard | 186.0 | 190.7 | 196.1 | 200.8 | 206.2 | 210.9 | 216.3 |
| Camarilla | 198.7 | 199.7 | 200.6 | 201.5 | 202.4 | 203.4 | 204.3 |
| Woodie | 186.4 | 190.9 | 196.5 | 201.0 | 206.6 | 211.1 | 216.7 |
| Fibonacci | 190.7 | 194.6 | 196.9 | 200.8 | 204.7 | 207.0 | 210.9 |
Numerical data
The following is the status of the technical indicators and moving averages at the time of publication of this technical analysis:
| RSI (14): | 71.70 | |
| MACD (12,26,9): | 3.0000 | |
| Directional Movement: | 14.1 | |
| AROON (14): | 71.5 | |
| DEMA (21): | 207.6 | |
| Parabolic SAR (0,02-0,02-0,2): | 201.2 | |
| Elder Ray (13): | 2.7 | |
| Super Trend (3,10): | 200.9 | |
| Zig ZAG (10): | 209.0 | |
| VORTEX (21): | 1.2000 | |
| Stochastique (14,3,5): | 97.50 | |
| TEMA (21): | 207.9 | |
| Williams %R (14): | -3.80 | |
| Chande Momentum Oscillator (20): | 10.4 | |
| Repulse (5,40,3): | 3.3000 | |
| ROCnROLL: | 1 | |
| TRIX (15,9): | 0.2000 | |
| Courbe Coppock: | 5.70 |
| MA7: | 206.9 | |
| MA20: | 203.6 | |
| MA50: | 198.3 | |
| MA100: | 186.9 | |
| MAexp7: | 207.0 | |
| MAexp20: | 203.8 | |
| MAexp50: | 197.7 | |
| MAexp100: | 189.4 | |
| Price / MA7: | -0.19% | |
| Price / MA20: | +1.42% | |
| Price / MA50: | +4.14% | |
| Price / MA100: | +10.49% | |
| Price / MAexp7: | -0.24% | |
| Price / MAexp20: | +1.32% | |
| Price / MAexp50: | +4.45% | |
| Price / MAexp100: | +9.03% |
News
The latest news and videos published on GCP STUDENT LIVING ORD 1P at the time of the analysis were as follows:
- GCP Student Living Plc - Investor Report 31 March 2019
- GCP Student Living Plc - Net Asset Value, Dividend and Portfolio Update
- GCP Student Living Plc - Forward purchase agreement
- GCP Student Living Plc - Director Change
- GCP Student Living Plc - Edison issues research
About author

Online


Add a comment
Comments
0 comments on the analysis GCP STUDENT LIVING ORD 1P - Daily