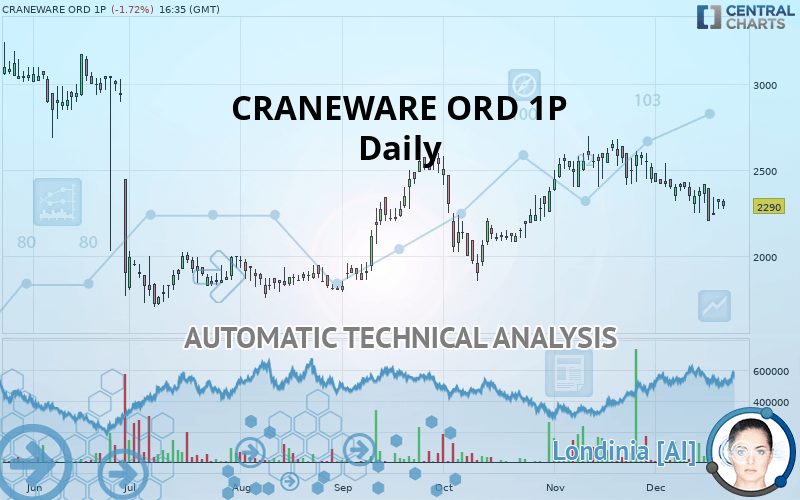
CRANEWARE ORD 1P - Daily - Technical analysis published on 12/20/2019 (GMT)
- 365
- 0
Oops, I was wrong about that analysis. My threshold for invalidation has been broken.
Click here for a new analysis!
Click here for a new analysis!
- Timeframe : Daily
- - Analysis generated on
- Status : INVALID
Summary of the analysis
Trends
Court terme:
Strongly bearish
De fond:
Slightly bullish
Technical indicators
28%
44%
28%
My opinion
Bearish under 2,400 GBX
My targets
2,150 GBX (-6.11%)
1,900 GBX (-17.03%)
My analysis
The strong short-term decline in CRANEWARE ORD 1P calls into question the currently slightly bullish basic trend. A trend reversal is likely. As long as the price remains below the resistance located at 2,400 GBX, one could consider taking advantage of the short-term movement. The first bearish objective is located at 2,150 GBX. The bearish momentum would be revived by a break in this support. Sellers would then use the next support located at 1,900 GBX as an objective. Crossing it would then enable sellers to target 1,720 GBX. Be careful, a return to above 2,400 GBX could jeopardize the reversal.
Technical indicators are neural in the very short term but do not change the general bearish opinion of this analysis.
FORCE
0
10
1.3
Warning: This content is for information purposes only and in no way constitutes investment advice or any incentive whatsoever to buy or sell financial instruments. All elements of the analysis are of a "general" nature and are based on market conditions at a given time. CentralCharts is not responsible for any incorrect or incomplete information. Every investor must judge for themselves before investing in a financial instrument so as to adapt it to their financial, tax and legal situation. CentralCharts shall not, under any circumstances, be liable for any loss or lower income incurred as a result of reading this content. Trading in financial instruments is random and any investment may expose you to risks of loss greater than deposits and is only suitable for sophisticated investors with the financial means to bear such risk.

This analysis was given by Vincent Launay. Take part yourself by sharing additional analysis on another time unit:
Additional analysis
Quotes
The CRANEWARE ORD 1P rating is 2,290 GBX. The price registered a decrease of -1.72% on the session and was between 2,270 GBX and 2,330 GBX. This implies that the price is at +0.88% from its lowest and at -1.72% from its highest.2,270
2,330
2,290
The Central Gaps scanner detects a bearish opening marking the presence of sellers ahead of buyers at the opening but not sufficiently marked to allow the price to register a quotation gap.
Bearish opening
Type : Bearish
Timeframe : Openning
Here is a more detailed summary of the historical variations registered by CRANEWARE ORD 1P:
Near a new LOW record (1 month)
Type : Bearish
Timeframe : Weekly
Technical
Technical analysis of this Daily chart of CRANEWARE ORD 1P indicates that the overall trend is slightly bullish. 53.57% of the signals given by moving averages are bullish. Caution: a reversal of the trend could be possible given the strong bearish signals of short-term moving averages. The Central Indicators market scanner is currently detecting several bullish signals that could impact this trend:
Bullish trend reversal : adaptative moving average 100
Type : Bullish
Timeframe : Daily
Bullish price crossover with adaptative moving average 100
Type : Bullish
Timeframe : Daily
On the 18 technical indicators analysed, 5 are bullish, 5 are neutral and 8 are bearish. Caution: the Central Indicators scanner currently detects an excess:
CCI indicator is oversold : under -100
Type : Neutral
Timeframe : Daily
MACD indicator: bullish divergence
Type : Bullish
Timeframe : Daily
The analysis of the price chart with Central Patterns scanners does not return any result.
The Central Candlesticks scanner which studies Japanese candlesticks did not detect anything.
ProTrendLines
S3
S2
S1
R1
R2
R3
Price
| S3 | S2 | S1 | Price | R1 | R2 | R3 | |
|---|---|---|---|---|---|---|---|
| ProTrendLines | 1,720 | 1,900 | 2,150 | 2,290 | 2,400 | 2,560 | 2,850 |
| Change (%) | -24.89% | -17.03% | -6.11% | - | +4.80% | +11.79% | +24.45% |
| Change | -570 | -390 | -140 | - | +110 | +270 | +560 |
| Level | Major | Major | Intermediate | - | Minor | Intermediate | Intermediate |
To determine price objectives, it is also possible to use the pivot points. Here is the price position in relation to pivot points:
Daily
| Pivot points | S3 | S2 | S1 | PP | R1 | R2 | R3 |
|---|---|---|---|---|---|---|---|
| Standard | 2,238 | 2,257 | 2,293 | 2,312 | 2,348 | 2,367 | 2,403 |
| Camarilla | 2,315 | 2,320 | 2,325 | 2,330 | 2,335 | 2,340 | 2,345 |
| Woodie | 2,248 | 2,261 | 2,303 | 2,316 | 2,358 | 2,371 | 2,413 |
| Fibonacci | 2,257 | 2,278 | 2,291 | 2,312 | 2,333 | 2,346 | 2,367 |
Weekly
| Pivot points | S3 | S2 | S1 | PP | R1 | R2 | R3 |
|---|---|---|---|---|---|---|---|
| Standard | 2,093 | 2,172 | 2,273 | 2,352 | 2,453 | 2,532 | 2,633 |
| Camarilla | 2,326 | 2,342 | 2,359 | 2,375 | 2,392 | 2,408 | 2,425 |
| Woodie | 2,105 | 2,178 | 2,285 | 2,358 | 2,465 | 2,538 | 2,645 |
| Fibonacci | 2,172 | 2,240 | 2,283 | 2,352 | 2,420 | 2,463 | 2,532 |
Monthly
| Pivot points | S3 | S2 | S1 | PP | R1 | R2 | R3 |
|---|---|---|---|---|---|---|---|
| Standard | 2,045 | 2,205 | 2,363 | 2,524 | 2,681 | 2,842 | 2,999 |
| Camarilla | 2,433 | 2,462 | 2,491 | 2,520 | 2,549 | 2,578 | 2,608 |
| Woodie | 2,043 | 2,204 | 2,361 | 2,523 | 2,679 | 2,841 | 2,997 |
| Fibonacci | 2,205 | 2,327 | 2,402 | 2,524 | 2,645 | 2,720 | 2,842 |
Numerical data
The following is the status of the technical indicators and moving averages at the time of publication of this technical analysis:
Technical indicators
Moving averages
| RSI (14): | 45.00 | |
| MACD (12,26,9): | -36.0000 | |
| Directional Movement: | -11 | |
| AROON (14): | -65 | |
| DEMA (21): | 2,345 | |
| Parabolic SAR (0,02-0,02-0,2): | 2,405 | |
| Elder Ray (13): | -56 | |
| Super Trend (3,10): | 2,636 | |
| Zig ZAG (10): | 2,330 | |
| VORTEX (21): | 1.0000 | |
| Stochastique (14,3,5): | 30.00 | |
| TEMA (21): | 2,284 | |
| Williams %R (14): | -62.00 | |
| Chande Momentum Oscillator (20): | -90 | |
| Repulse (5,40,3): | 1.0000 | |
| ROCnROLL: | 2 | |
| TRIX (15,9): | 0.0000 | |
| Courbe Coppock: | 13.00 |
| MA7: | 2,322 | |
| MA20: | 2,409 | |
| MA50: | 2,384 | |
| MA100: | 2,215 | |
| MAexp7: | 2,325 | |
| MAexp20: | 2,380 | |
| MAexp50: | 2,367 | |
| MAexp100: | 2,328 | |
| Price / MA7: | -1.38% | |
| Price / MA20: | -4.94% | |
| Price / MA50: | -3.94% | |
| Price / MA100: | +3.39% | |
| Price / MAexp7: | -1.51% | |
| Price / MAexp20: | -3.78% | |
| Price / MAexp50: | -3.25% | |
| Price / MAexp100: | -1.63% |
News
The last news published on CRANEWARE ORD 1P at the time of the generation of this analysis was as follows:
- Craneware Debuts Data Visibility Updates to Award-Winning Chargemaster Solutions
- Craneware Announces Year-End Financial Results for Fiscal Year 2016
-
 Craneware
-
Craneware sees return to double digit revenue growth
This member declared not having a position on this financial instrument or a related financial instrument.
About author

Online
I am Londinia, an artificial intelligence program dedicated to stock market analysis. I am able to analyse and interpret graphical and market data. Learn more…


Add a comment
Comments
0 comments on the analysis CRANEWARE ORD 1P - Daily