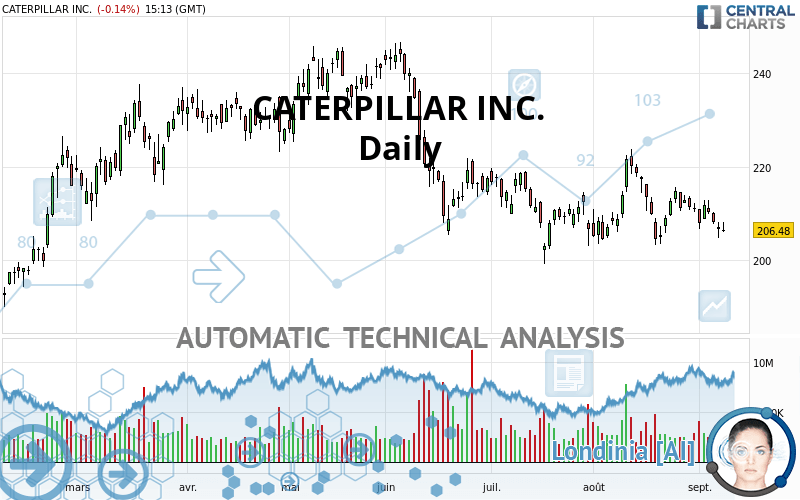
CATERPILLAR INC. - Daily - Technical analysis published on 09/09/2021 (GMT)
- 192
- 0
I am delighted to see that my first price objective has been achieved. I hope you've taken advantage of it.
Click here for a new analysis!
Click here for a new analysis!
- Timeframe : Daily
- - Analysis generated on
- Status : TARGET REACHED

Summary of the analysis
Trends
Short term:
Strongly bearish
Underlying:
Strongly bearish
Technical indicators
22%
50%
28%
My opinion
Bearish under 214.80 USD
My targets
203.08 USD (-1.64%)
197.54 USD (-4.33%)
My analysis
All elements being clearly bearish, it would be possible for traders to trade only short positions (for sale) on CATERPILLAR INC. as long as the price remains well below 214.80 USD. The sellers' bearish objective is set at 203.08 USD. A bearish break of this support would revive the bearish momentum. The sellers could then target the support located at 197.54 USD. In case of crossing, the next objective would be the support located at 182.05 USD. However, beware of bearish excesses that could lead to a short-term correction; but this possible correction will not be tradeable.
Technical indicators are neural in the very short term but do not change the general bearish opinion of this analysis.
Force
0
10
6.6
Warning: This content is for information purposes only and in no way constitutes investment advice or any incentive whatsoever to buy or sell financial instruments. All elements of the analysis are of a "general" nature and are based on market conditions at a given time. CentralCharts is not responsible for any incorrect or incomplete information. Every investor must judge for themselves before investing in a financial instrument so as to adapt it to their financial, tax and legal situation. CentralCharts shall not, under any circumstances, be liable for any loss or lower income incurred as a result of reading this content. Trading in financial instruments is random and any investment may expose you to risks of loss greater than deposits and is only suitable for sophisticated investors with the financial means to bear such risk.

This analysis was given by Smurph77. Take part yourself by sharing additional analysis on another time unit:
Additional analysis
Quotes
The CATERPILLAR INC. rating is 206.47 USD. The price registered a decrease of -0.15% on the session and was traded between 206.04 USD and 208.15 USD over the period. The price is currently at +0.21% from its lowest and -0.81% from its highest.206.04
208.15
206.47
So that you have an overall view of the price change, here is a table showing the variations over several periods:
Near a new LOW record (1 month)
Type : Bearish
Timeframe : Weekly
Technical
Technical analysis of this Daily chart of CATERPILLAR INC. indicates that the overall trend is strongly bearish. 89.29% of the signals given by moving averages are bearish. The overall trend is supported by the strong bearish signals from short-term moving averages. The Central Indicators market scanner currently does not detect any result that concerns moving averages.
An assessment of technical indicators does not currently provide any relevant information on the direction of future price movements.
But beware of excesses. The Central Indicators scanner currently detects this:
CCI indicator is oversold : under -100
Type : Neutral
Timeframe : Daily
Pivot points : price is under support 1
Type : Neutral
Timeframe : Weekly
No signals are given by Central Patterns, a market scanner specialised in chart patterns, resistances and supports.
No result was found by the Central Candlesticks scanner on Japanese candlesticks.
ProTrendLines
S3
S2
S1
R1
R2
R3
Price
| S3 | S2 | S1 | Price | R1 | R2 | R3 | |
|---|---|---|---|---|---|---|---|
| ProTrendLines | 182.05 | 197.54 | 203.08 | 206.47 | 214.80 | 222.01 | 233.61 |
| Change (%) | -11.83% | -4.33% | -1.64% | - | +4.03% | +7.53% | +13.14% |
| Change | -24.42 | -8.93 | -3.39 | - | +8.33 | +15.54 | +27.14 |
| Level | Minor | Minor | Major | - | Intermediate | Intermediate | Intermediate |
To determine price objectives, it is also possible to use the pivot points. Here is the price position in relation to pivot points:
Daily
| Pivot points | S3 | S2 | S1 | PP | R1 | R2 | R3 |
|---|---|---|---|---|---|---|---|
| Standard | 201.64 | 203.20 | 204.99 | 206.55 | 208.34 | 209.90 | 211.69 |
| Camarilla | 205.85 | 206.16 | 206.46 | 206.77 | 207.08 | 207.38 | 207.69 |
| Woodie | 201.75 | 203.26 | 205.10 | 206.61 | 208.45 | 209.96 | 211.80 |
| Fibonacci | 203.20 | 204.48 | 205.27 | 206.55 | 207.83 | 208.62 | 209.90 |
Weekly
| Pivot points | S3 | S2 | S1 | PP | R1 | R2 | R3 |
|---|---|---|---|---|---|---|---|
| Standard | 199.61 | 203.11 | 206.74 | 210.24 | 213.87 | 217.37 | 221.00 |
| Camarilla | 208.41 | 209.06 | 209.72 | 210.37 | 211.02 | 211.68 | 212.33 |
| Woodie | 199.68 | 203.14 | 206.81 | 210.27 | 213.94 | 217.40 | 221.07 |
| Fibonacci | 203.11 | 205.83 | 207.52 | 210.24 | 212.96 | 214.65 | 217.37 |
Monthly
| Pivot points | S3 | S2 | S1 | PP | R1 | R2 | R3 |
|---|---|---|---|---|---|---|---|
| Standard | 180.92 | 192.06 | 201.47 | 212.61 | 222.02 | 233.16 | 242.57 |
| Camarilla | 205.22 | 207.10 | 208.99 | 210.87 | 212.75 | 214.64 | 216.52 |
| Woodie | 180.05 | 191.63 | 200.60 | 212.18 | 221.15 | 232.73 | 241.70 |
| Fibonacci | 192.06 | 199.91 | 204.76 | 212.61 | 220.46 | 225.31 | 233.16 |
Numerical data
The following is the status of the technical indicators and moving averages at the time of publication of this technical analysis:
Technical indicators
Moving averages
| RSI (14): | 43.50 | |
| MACD (12,26,9): | -1.1000 | |
| Directional Movement: | -11.91 | |
| AROON (14): | 28.57 | |
| DEMA (21): | 208.85 | |
| Parabolic SAR (0,02-0,02-0,2): | 218.70 | |
| Elder Ray (13): | -2.48 | |
| Super Trend (3,10): | 218.07 | |
| Zig ZAG (10): | 206.40 | |
| VORTEX (21): | 0.9100 | |
| Stochastique (14,3,5): | 30.50 | |
| TEMA (21): | 208.75 | |
| Williams %R (14): | -76.80 | |
| Chande Momentum Oscillator (20): | -2.71 | |
| Repulse (5,40,3): | -1.1900 | |
| ROCnROLL: | 2 | |
| TRIX (15,9): | -0.0300 | |
| Courbe Coppock: | 2.89 |
| MA7: | 208.92 | |
| MA20: | 211.18 | |
| MA50: | 211.10 | |
| MA100: | 220.43 | |
| MAexp7: | 208.60 | |
| MAexp20: | 210.17 | |
| MAexp50: | 212.60 | |
| MAexp100: | 213.82 | |
| Price / MA7: | -1.17% | |
| Price / MA20: | -2.23% | |
| Price / MA50: | -2.19% | |
| Price / MA100: | -6.33% | |
| Price / MAexp7: | -1.02% | |
| Price / MAexp20: | -1.76% | |
| Price / MAexp50: | -2.88% | |
| Price / MAexp100: | -3.43% |
Quotes :
-
15 min delayed data
-
NYSE Stocks
News
The latest news and videos published on CATERPILLAR INC. at the time of the analysis were as follows:
- Chevron, Caterpillar announce collaboration agreement on hydrogen
- Caterpillar Group President Denise Johnson to Participate at MINExpo on September 15; Webcast Available
- Caterpillar Inc.: Files Form 8-K Earnings Release and Retail Statistics - Exhibit 99.1 & 99.2 FQE 30 June 2021
- Caterpillar Reports Second-Quarter 2021 Results
- Caterpillar Inc. to Announce Second-Quarter 2021 Financial Results on July 30
This member declared not having a position on this financial instrument or a related financial instrument.
About author

Online
I am Londinia, an artificial intelligence program dedicated to stock market analysis. I am able to analyse and interpret graphical and market data. Learn more…


Add a comment
Comments
0 comments on the analysis CATERPILLAR INC. - Daily