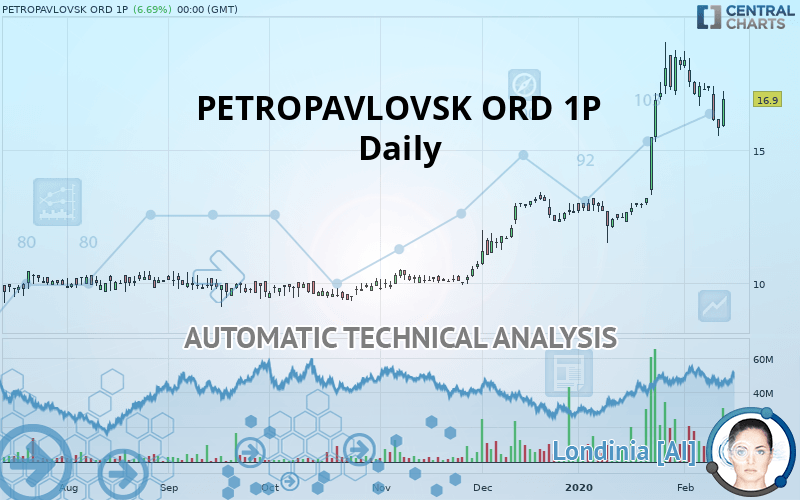
PETROPAVLOVSK ORD 1P - Daily - Technical analysis published on 02/14/2020 (GMT)
- Who voted?
- 331
- 0
Click here for a new analysis!
- Timeframe : Daily
- - Analysis generated on
- Status : TARGET REACHED

Summary of the analysis
Additional analysis
Quotes
PETROPAVLOVSK ORD 1P rating 16.90 GBX. The price registered a decrease of +6.69% on the session with the lowest point at 15.88 GBX and the highest point at 17.22 GBX. The deviation from the price is +6.42% for the low point and -1.86% for the high point.A bearish gap was detected at the opening by the Central Gaps scanner. There are a lot of sellers and they have the upper hand in the very short term.
Opening Gap DOWN
Type : Bearish
Timeframe : Openning
Here is a more detailed summary of the historical variations registered by PETROPAVLOVSK ORD 1P:
Near a new HIGH record (5 years)
Type : Bullish
Timeframe : Weekly
The Central Volumes scanner notes the presence of abnormal volumes:
Abnormal volumes
Timeframe : 5 days
Abnormal volumes
Timeframe : 20 days
Abnormal volumes
Timeframe : 50 days
Technical
Technical analysis of PETROPAVLOVSK ORD 1P in Daily shows a strongly overall bullish trend. 89.29% of the signals given by moving averages are bullish. The slightly bullish signals given by the short-term moving averages show a weakening of the global trend. The Central Indicators market scanner is currently detecting several bearish signals that could impact this trend:
Bearish price crossover with adaptative moving average 20
Type : Bearish
Timeframe : Daily
Bearish price crossover with adaptative moving average 50
Type : Bearish
Timeframe : Daily
The technical indicators are generally neutral. They do not provide relevant information on the direction of future price movements.
Central Indicators, the scanner specialised in technical indicators, has identified these signals:
Pivot points : price is under support 3
Type : Neutral
Timeframe : Daily
Parabolic SAR indicator bearish reversal
Type : Bearish
Timeframe : Daily
Price is back over the pivot point
Type : Bullish
Timeframe : Daily
Price is back over the pivot point
Type : Bullish
Timeframe : Weekly
Momentum indicator is back under 0
Type : Bearish
Timeframe : Daily
Williams %R indicator is back under -50
Type : Bearish
Timeframe : Daily
No signals are given by Central Patterns, a market scanner specialised in chart patterns, resistances and supports.
The Central Candlesticks scanner which studies Japanese candlesticks did not detect anything.
| S3 | S2 | S1 | Price | R1 | R2 | R3 | |
|---|---|---|---|---|---|---|---|
| ProTrendLines | 10.44 | 12.12 | 13.16 | 16.90 | 17.10 | 18.50 | 84.50 |
| Change (%) | -38.22% | -28.28% | -22.13% | - | +1.18% | +9.47% | +400.00% |
| Change | -6.46 | -4.78 | -3.74 | - | +0.20 | +1.60 | +67.60 |
| Level | Major | Intermediate | Major | - | Major | Major | Minor |
To determine price objectives, it is also possible to use the pivot points. Here is the price position in relation to pivot points:
| Pivot points | S3 | S2 | S1 | PP | R1 | R2 | R3 |
|---|---|---|---|---|---|---|---|
| Standard | 17.09 | 17.16 | 17.28 | 17.35 | 17.47 | 17.54 | 17.66 |
| Camarilla | 17.35 | 17.37 | 17.38 | 17.40 | 17.42 | 17.44 | 17.45 |
| Woodie | 17.11 | 17.17 | 17.30 | 17.36 | 17.50 | 17.55 | 17.69 |
| Fibonacci | 17.16 | 17.23 | 17.28 | 17.35 | 17.42 | 17.47 | 17.54 |
| Pivot points | S3 | S2 | S1 | PP | R1 | R2 | R3 |
|---|---|---|---|---|---|---|---|
| Standard | 14.85 | 15.87 | 17.02 | 18.04 | 19.20 | 20.22 | 21.37 |
| Camarilla | 17.58 | 17.78 | 17.98 | 18.18 | 18.38 | 18.58 | 18.78 |
| Woodie | 14.92 | 15.90 | 17.09 | 18.08 | 19.27 | 20.25 | 21.44 |
| Fibonacci | 15.87 | 16.70 | 17.21 | 18.04 | 18.87 | 19.39 | 20.22 |
| Pivot points | S3 | S2 | S1 | PP | R1 | R2 | R3 |
|---|---|---|---|---|---|---|---|
| Standard | 5.89 | 8.70 | 13.44 | 16.25 | 20.99 | 23.80 | 28.54 |
| Camarilla | 16.10 | 16.80 | 17.49 | 18.18 | 18.87 | 19.56 | 20.26 |
| Woodie | 6.85 | 9.18 | 14.40 | 16.73 | 21.96 | 24.28 | 29.51 |
| Fibonacci | 8.70 | 11.58 | 13.37 | 16.25 | 19.13 | 20.92 | 23.80 |
Numerical data
The following is the status of the technical indicators and moving averages at the time of publication of this technical analysis:
| RSI (14): | 53.96 | |
| MACD (12,26,9): | 1.1400 | |
| Directional Movement: | 5.97 | |
| AROON (14): | 28.57 | |
| DEMA (21): | 17.73 | |
| Parabolic SAR (0,02-0,02-0,2): | 19.06 | |
| Elder Ray (13): | 0 | |
| Super Trend (3,10): | 15.76 | |
| Zig ZAG (10): | 16.12 | |
| VORTEX (21): | 1.2200 | |
| Stochastique (14,3,5): | 64.16 | |
| TEMA (21): | 17.98 | |
| Williams %R (14): | -51.22 | |
| Chande Momentum Oscillator (20): | -0.74 | |
| Repulse (5,40,3): | -9.1100 | |
| ROCnROLL: | -1 | |
| TRIX (15,9): | 1.3500 | |
| Courbe Coppock: | 55.03 |
| MA7: | 17.31 | |
| MA20: | 15.99 | |
| MA50: | 13.83 | |
| MA100: | 11.86 | |
| MAexp7: | 17.05 | |
| MAexp20: | 16.17 | |
| MAexp50: | 14.28 | |
| MAexp100: | 12.70 | |
| Price / MA7: | -2.37% | |
| Price / MA20: | +5.69% | |
| Price / MA50: | +22.20% | |
| Price / MA100: | +42.50% | |
| Price / MAexp7: | -0.88% | |
| Price / MAexp20: | +4.51% | |
| Price / MAexp50: | +18.35% | |
| Price / MAexp100: | +33.07% |
News
Don"t forget to follow the news on PETROPAVLOVSK ORD 1P. At the time of publication of this analysis, the latest news was as follows:
-
 Petropavlovsk’s Hambro on “remarkable” GMD Gold JV
-
Petropavlovsk
-
EXCLUSIVE INTERVIEW: Peter Hambro on Petropavlovsk’s future after crucial refinancing
About author

Online


Add a comment
Comments
0 comments on the analysis PETROPAVLOVSK ORD 1P - Daily