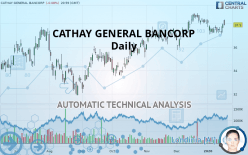
CATHAY GENERAL BANCORP - Daily - Technical analysis published on 01/21/2020 (GMT)
- Who voted?
- 208
- 0
Click here for a new analysis!
- Timeframe : Daily
- - Analysis generated on
- Status : LEVEL MAINTAINED

Summary of the analysis

Additional analysis
Quotes
CATHAY GENERAL BANCORP rating 37.90 USD. The price registered an increase of -0.08% on the session with the lowest point at 37.86 USD and the highest point at 38.36 USD. The deviation from the price is +0.11% for the low point and -1.20% for the high point.A bullish gap was detected at the opening by the Central Gaps scanner. There are a lot of buyers and they have the upper hand in the very short term.
Opening Gap UP
Type : Bullish
Timeframe : Openning
A study of price movements over other periods shows the following variations:
Near a new HIGH record (1 year)
Type : Bullish
Timeframe : Weekly
Technical
Technical analysis of this Daily chart of CATHAY GENERAL BANCORP indicates that the overall trend is strongly bullish. The signals given by moving averages are 89.29% bullish. This strongly bullish trend seems to be running out of steam given the signals being given by short-term moving averages. An assessment of moving averages reveals several bullish signals that could impact this trend:
Bullish trend reversal : adaptative moving average 20
Type : Bullish
Timeframe : Daily
Bullish price crossover with Moving Average 20
Type : Bullish
Timeframe : Daily
Bullish price crossover with Moving Average 50
Type : Bullish
Timeframe : Daily
Bullish price crossover with adaptative moving average 20
Type : Bullish
Timeframe : Daily
In fact, Central Analyzer took into account 18 technical indicators and the result was as follows: 7 are bullish, 5 are neutral and 6 are bearish. Caution: the Central Indicators scanner currently detects an excess:
Williams %R indicator is overbought : over -20
Type : Neutral
Timeframe : Daily
Pivot points : price is over resistance 1
Type : Neutral
Timeframe : Weekly
RSI indicator is back over 50
Type : Bullish
Timeframe : Daily
MACD indicator is back over 0
Type : Bullish
Timeframe : Daily
Price is back over the pivot point
Type : Bullish
Timeframe : Daily
Williams %R indicator is back over -50
Type : Bullish
Timeframe : Daily
Central Patterns, the scanner specializing in chart patterns, did not identify any signals.
The Central Candlesticks scanner which studies Japanese candlesticks did not detect anything.
| S3 | S2 | S1 | Price | R1 | R2 | R3 | |
|---|---|---|---|---|---|---|---|
| ProTrendLines | 34.41 | 35.74 | 37.48 | 37.90 | 38.73 | 39.92 | 42.22 |
| Change (%) | -9.21% | -5.70% | -1.11% | - | +2.19% | +5.33% | +11.40% |
| Change | -3.49 | -2.16 | -0.42 | - | +0.83 | +2.02 | +4.32 |
| Level | Major | Minor | Major | - | Intermediate | Major | Minor |
Pivot points can also be used to set your price objectives. Here is the price situation in relation to pivot points:
| Pivot points | S3 | S2 | S1 | PP | R1 | R2 | R3 |
|---|---|---|---|---|---|---|---|
| Standard | 36.66 | 36.95 | 37.44 | 37.73 | 38.22 | 38.51 | 39.00 |
| Camarilla | 37.72 | 37.79 | 37.86 | 37.93 | 38.00 | 38.07 | 38.15 |
| Woodie | 36.76 | 37.00 | 37.54 | 37.78 | 38.32 | 38.56 | 39.10 |
| Fibonacci | 36.95 | 37.25 | 37.43 | 37.73 | 38.03 | 38.21 | 38.51 |
| Pivot points | S3 | S2 | S1 | PP | R1 | R2 | R3 |
|---|---|---|---|---|---|---|---|
| Standard | 36.32 | 36.73 | 37.02 | 37.43 | 37.72 | 38.13 | 38.42 |
| Camarilla | 37.11 | 37.18 | 37.24 | 37.31 | 37.37 | 37.43 | 37.50 |
| Woodie | 36.26 | 36.70 | 36.96 | 37.40 | 37.66 | 38.10 | 38.36 |
| Fibonacci | 36.73 | 37.00 | 37.16 | 37.43 | 37.70 | 37.86 | 38.13 |
| Pivot points | S3 | S2 | S1 | PP | R1 | R2 | R3 |
|---|---|---|---|---|---|---|---|
| Standard | 33.07 | 34.41 | 36.23 | 37.57 | 39.39 | 40.73 | 42.55 |
| Camarilla | 37.18 | 37.47 | 37.76 | 38.05 | 38.34 | 38.63 | 38.92 |
| Woodie | 33.31 | 34.53 | 36.47 | 37.69 | 39.63 | 40.85 | 42.79 |
| Fibonacci | 34.41 | 35.62 | 36.36 | 37.57 | 38.78 | 39.52 | 40.73 |
Numerical data
The following is the status of technical indicators and moving averages registered at the time this technical analysis was created:
| RSI (14): | 54.10 | |
| MACD (12,26,9): | 0.0300 | |
| Directional Movement: | 3.76 | |
| AROON (14): | -78.57 | |
| DEMA (21): | 37.80 | |
| Parabolic SAR (0,02-0,02-0,2): | 37.08 | |
| Elder Ray (13): | 0.40 | |
| Super Trend (3,10): | 37.03 | |
| Zig ZAG (10): | 37.90 | |
| VORTEX (21): | 0.9400 | |
| Stochastique (14,3,5): | 48.55 | |
| TEMA (21): | 37.58 | |
| Williams %R (14): | -37.74 | |
| Chande Momentum Oscillator (20): | -0.15 | |
| Repulse (5,40,3): | -0.4200 | |
| ROCnROLL: | 1 | |
| TRIX (15,9): | 0.0300 | |
| Courbe Coppock: | 3.48 |
| MA7: | 37.60 | |
| MA20: | 37.89 | |
| MA50: | 37.49 | |
| MA100: | 36.15 | |
| MAexp7: | 37.69 | |
| MAexp20: | 37.71 | |
| MAexp50: | 37.33 | |
| MAexp100: | 36.68 | |
| Price / MA7: | +0.80% | |
| Price / MA20: | +0.03% | |
| Price / MA50: | +1.09% | |
| Price / MA100: | +4.84% | |
| Price / MAexp7: | +0.56% | |
| Price / MAexp20: | +0.50% | |
| Price / MAexp50: | +1.53% | |
| Price / MAexp100: | +3.33% |
News
The latest news and videos published on CATHAY GENERAL BANCORP at the time of the analysis were as follows:
- Cathay General Bancorp to Announce Fourth Quarter and Full Year 2019 Financial Results
- Cathay General Bancorp Declares $0.31 Per Share Dividend
- Cathay General Bancorp Announces Third Quarter 2019 Results
- Cathay General Bancorp to Announce Third Quarter 2019 Financial Results
- Cathay General Bancorp Declares $0.31 Per Share Dividend
About author

Online


Add a comment
Comments
0 comments on the analysis CATHAY GENERAL BANCORP - Daily