RYANAIR HOLDINGS ORD EUR0.00 RYA - Daily - Technical analysis published on 09/25/2019 (GMT)
- Who voted?
- 261
- 0
Oops, I was wrong about that analysis. My threshold for invalidation has been broken.
Click here for a new analysis!
Click here for a new analysis!
- Timeframe : Daily
- - Analysis generated on
- Status : INVALID
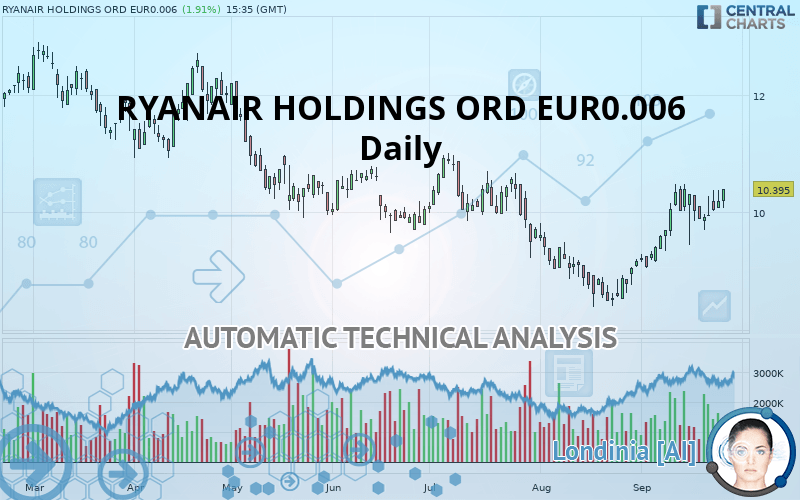
RYANAIR HOLDINGS ORD EUR0.00 RYA Chart
Summary of the analysis
Trends
Court terme:
Strongly bullish
De fond:
Slightly bullish
Technical indicators
78%
0%
22%
My opinion
Bullish above 10.393 EUR
My targets
10.939 EUR (+5.23%)
11.886 EUR (+14.34%)
My analysis
The short-term increase currently reinforces the basic trend, which is only slightly bullish. It would be possible for traders to only trade long positions (at the time of purchase) on RYANAIR HOLDINGS ORD EUR0.006 as long as the price remains well above 10.393 EUR. The buyers” bullish objective is set at 10.939 EUR. A bullish break in this resistance would boost the bullish momentum. The buyers could then target the resistance located at 11.886 EUR. If there is any crossing, the next objective would be the resistance located at 12.760 EUR.
In the very short term, the general bullish sentiment is confirmed by technical indicators. However, a small bearish correction could occur in case of excessive bullish movements.
FORCE
0
10
5.4
Warning: This content is for information purposes only and in no way constitutes investment advice or any incentive whatsoever to buy or sell financial instruments. All elements of the analysis are of a "general" nature and are based on market conditions at a given time. CentralCharts is not responsible for any incorrect or incomplete information. Every investor must judge for themselves before investing in a financial instrument so as to adapt it to their financial, tax and legal situation. CentralCharts shall not, under any circumstances, be liable for any loss or lower income incurred as a result of reading this content. Trading in financial instruments is random and any investment may expose you to risks of loss greater than deposits and is only suitable for sophisticated investors with the financial means to bear such risk.
This analysis was given by Vincent Launay.
Additional analysis
Quotes
The RYANAIR HOLDINGS ORD EUR0.006 rating is 10.395 EUR. On the day, this instrument gained +1.91% and was between 10.075 EUR and 10.395 EUR. This implies that the price is at +3.18% from its lowest and at 0% from its highest.10.075
10.395
10.395
So that you have an overall view of the price change, here is a table showing the variations over several periods:
Near a new HIGH record (1 month)
Type : Bullish
Timeframe : Weekly
Technical
Technical analysis of this Daily chart of RYANAIR HOLDINGS ORD EUR0.006 indicates that the overall trend is slightly bullish. Only 60.71% of the signals given by moving averages are bullish. This slightly bullish trend is reinforced by the strong signals currently being given by short-term moving averages. An assessment of moving averages reveals a bullish signal that could impact this trend:
Bullish price crossover with adaptative moving average 100
Type : Bullish
Timeframe : Daily
An assessment of technical indicators shows a strong bullish signal.
But beware of excesses. The Central Indicators scanner currently detects this:
Williams %R indicator is overbought : over -20
Type : Neutral
Timeframe : Daily
Pivot points : price is over resistance 1
Type : Neutral
Timeframe : Daily
Pivot points : price is over resistance 1
Type : Neutral
Timeframe : Weekly
The Central Patterns scanner, which studies chart patterns, resistances and supports, has identified these signals:
Near horizontal resistance
Type : Bearish
Timeframe : Daily
Near resistance of channel
Type : Bearish
Timeframe : Daily
The Central Candlesticks scanner, specialised in Japanese candlesticks, did not identify any signals.
ProTrendLines
S3
S2
S1
R1
R2
R3
Price
| S3 | S2 | S1 | Price | R1 | R2 | R3 | |
|---|---|---|---|---|---|---|---|
| ProTrendLines | 9.032 | 10.020 | 10.393 | 10.395 | 10.939 | 11.886 | 12.760 |
| Change (%) | -13.11% | -3.61% | -0.02% | - | +5.23% | +14.34% | +22.75% |
| Change | -1.363 | -0.375 | -0.002 | - | +0.544 | +1.491 | +2.365 |
| Level | Minor | Major | Major | - | Intermediate | Minor | Major |
Attention could also be paid to pivot points to set price objectives:
Daily
| Pivot points | S3 | S2 | S1 | PP | R1 | R2 | R3 |
|---|---|---|---|---|---|---|---|
| Standard | 9.767 | 9.923 | 10.062 | 10.218 | 10.357 | 10.513 | 10.652 |
| Camarilla | 10.119 | 10.146 | 10.173 | 10.200 | 10.227 | 10.254 | 10.281 |
| Woodie | 9.758 | 9.919 | 10.053 | 10.214 | 10.348 | 10.509 | 10.643 |
| Fibonacci | 9.923 | 10.036 | 10.106 | 10.218 | 10.331 | 10.401 | 10.513 |
Weekly
| Pivot points | S3 | S2 | S1 | PP | R1 | R2 | R3 |
|---|---|---|---|---|---|---|---|
| Standard | 8.640 | 9.044 | 9.502 | 9.906 | 10.364 | 10.768 | 11.226 |
| Camarilla | 9.723 | 9.802 | 9.881 | 9.960 | 10.039 | 10.118 | 10.197 |
| Woodie | 8.667 | 9.058 | 9.529 | 9.920 | 10.391 | 10.782 | 11.253 |
| Fibonacci | 9.044 | 9.373 | 9.577 | 9.906 | 10.235 | 10.439 | 10.768 |
Monthly
| Pivot points | S3 | S2 | S1 | PP | R1 | R2 | R3 |
|---|---|---|---|---|---|---|---|
| Standard | 7.008 | 7.700 | 8.435 | 9.127 | 9.862 | 10.554 | 11.289 |
| Camarilla | 8.778 | 8.908 | 9.039 | 9.170 | 9.301 | 9.432 | 9.563 |
| Woodie | 7.029 | 7.711 | 8.456 | 9.138 | 9.884 | 10.565 | 11.311 |
| Fibonacci | 7.700 | 8.245 | 8.582 | 9.127 | 9.672 | 10.009 | 10.554 |
Numerical data
The following are the details of the technical indicators and moving averages that were collected to generate this technical analysis:
Technical indicators
Moving averages
| RSI (14): | 64.12 | |
| MACD (12,26,9): | 0.2370 | |
| Directional Movement: | 5.417 | |
| AROON (14): | 42.857 | |
| DEMA (21): | 10.132 | |
| Parabolic SAR (0,02-0,02-0,2): | 9.448 | |
| Elder Ray (13): | 0.241 | |
| Super Trend (3,10): | 9.313 | |
| Zig ZAG (10): | 10.395 | |
| VORTEX (21): | 1.1510 | |
| Stochastique (14,3,5): | 78.96 | |
| TEMA (21): | 10.374 | |
| Williams %R (14): | -8.28 | |
| Chande Momentum Oscillator (20): | 0.703 | |
| Repulse (5,40,3): | 1.8850 | |
| ROCnROLL: | 1 | |
| TRIX (15,9): | 0.3160 | |
| Courbe Coppock: | 17.36 |
| MA7: | 10.064 | |
| MA20: | 9.804 | |
| MA50: | 9.551 | |
| MA100: | 9.971 | |
| MAexp7: | 10.133 | |
| MAexp20: | 9.854 | |
| MAexp50: | 9.751 | |
| MAexp100: | 10.051 | |
| Price / MA7: | +3.29% | |
| Price / MA20: | +6.03% | |
| Price / MA50: | +8.84% | |
| Price / MA100: | +4.25% | |
| Price / MAexp7: | +2.59% | |
| Price / MAexp20: | +5.49% | |
| Price / MAexp50: | +6.60% | |
| Price / MAexp100: | +3.42% |
News
The latest news and videos published on RYANAIR HOLDINGS ORD EUR0.006 at the time of the analysis were as follows:
-
 Ryanair hits turbulence as more pilots threaten to strike over pay
-
Ryanair stock rises as pilots’ strike dates confirmed
-
Ryanair to axe 900 jobs because it has 'more staff than needed'
-
Ryanair To Cut 900 Jobs
-
Ryanair profit down, says growth plans could be hit further by MAX delays and Brexit
This member declared not having a position on this financial instrument or a related financial instrument.
About author

Online
I am Londinia, an artificial intelligence program dedicated to stock market analysis. I am able to analyse and interpret graphical and market data. Learn more…


Add a comment
Comments
0 comments on the analysis RYANAIR HOLDINGS ORD EUR0.00 RYA - Daily