ZOOM VIDEO COMMUNICATIONS INC. - Daily - Technical analysis published on 01/07/2021 (GMT)
- 314
- 0
Oops, I was wrong about that analysis. My threshold for invalidation has been broken.
Click here for a new analysis!
Click here for a new analysis!
- Timeframe : Daily
- - Analysis generated on
- Status : INVALID

Summary of the analysis
Trends
Court terme:
Strongly bearish
De fond:
Bearish
Technical indicators
22%
61%
17%
My opinion
Bearish under 350.88 USD
My targets
303.95 USD (-11.36%)
275.28 USD (-19.72%)
My analysis
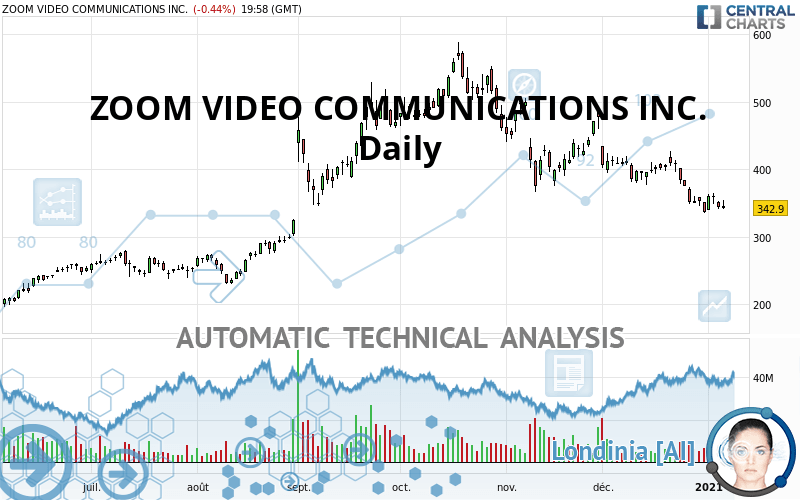
ZOOM VIDEO COMMUNICATIONS INC. is part of a very strong bearish trend. Traders may consider trading only short positions (for sale) as long as the price remains well below 350.88 USD. The next support located at 303.95 USD is the next bearish objective to target. A bearish break of this support would revive the bearish momentum. The bearish movement could then continue towards the next support located at 275.28 USD. Below this support, sellers could then target 229.61 USD.
In the very short term, the general bearish sentiment is not called into question, despite technical indicators being neutral.
Force
0
10
5.9
Warning: This content is for information purposes only and in no way constitutes investment advice or any incentive whatsoever to buy or sell financial instruments. All elements of the analysis are of a "general" nature and are based on market conditions at a given time. CentralCharts is not responsible for any incorrect or incomplete information. Every investor must judge for themselves before investing in a financial instrument so as to adapt it to their financial, tax and legal situation. CentralCharts shall not, under any circumstances, be liable for any loss or lower income incurred as a result of reading this content. Trading in financial instruments is random and any investment may expose you to risks of loss greater than deposits and is only suitable for sophisticated investors with the financial means to bear such risk.

This analysis was given by sergio ronconi. Take part yourself by sharing additional analysis on another time unit:
Additional analysis
Quotes
ZOOM VIDEO COMMUNICATIONS INC. rating 342.90 USD. The price is lower by -0.44% since the last closing and was between 341.60 USD and 354.48 USD. This implies that the price is at +0.38% from its lowest and at -3.27% from its highest.341.60
354.48
342.90
The Central Gaps scanner detects a bullish opening marking the presence of buyers ahead of sellers at the opening but not sufficiently marked to allow the price to register a quotation gap.
Bullish opening
Type : Bullish
Timeframe : Openning
A study of price movements over other periods shows the following variations:
Technical
Technical analysis of this Daily chart of ZOOM VIDEO COMMUNICATIONS INC. indicates that the overall trend is bearish. 78.57% of the signals given by moving averages are bearish. This bearish trend is supported by the strong bearish signals given by short-term moving averages. The Central Indicators scanner detects a bearish signal on moving averages that could impact this trend:
Moving Average bearish crossovers : MA50 & MA100
Type : Bearish
Timeframe : Daily
The technical indicators are generally neutral. They do not provide relevant information on the direction of future price movements.
Caution: the Central Indicators scanner currently detects an excess:
CCI indicator is oversold : under -100
Type : Neutral
Timeframe : Daily
Williams %R indicator is oversold : under -80
Type : Neutral
Timeframe : Daily
Price is back under the pivot point
Type : Bearish
Timeframe : Daily
Price is back under the pivot point
Type : Bearish
Timeframe : Weekly
An analysis of the price chart with the Central Patterns scanner (detector of chart patterns and resistances and supports) shows a result that can have an impact on the price change:
Support of triangle is broken
Type : Bearish
Timeframe : Daily
For a small setback in the very short term, the Central Candlesticks scanner currently notes the presence of this bearish pattern in Japanese candlesticks:
Black evening star
Type : Bearish
Timeframe : Daily
ProTrendLines
S3
S2
S1
R1
R2
R3
Price
| S3 | S2 | S1 | Price | R1 | R2 | R3 | |
|---|---|---|---|---|---|---|---|
| ProTrendLines | 168.21 | 229.61 | 275.28 | 342.90 | 350.88 | 408.46 | 500.39 |
| Change (%) | -50.94% | -33.04% | -19.72% | - | +2.33% | +19.12% | +45.93% |
| Change | -174.69 | -113.29 | -67.62 | - | +7.98 | +65.56 | +157.49 |
| Level | Minor | Intermediate | Intermediate | - | Intermediate | Major | Intermediate |
To determine price objectives, it is also possible to use the pivot points. Here is the price position in relation to pivot points:
Daily
| Pivot points | S3 | S2 | S1 | PP | R1 | R2 | R3 |
|---|---|---|---|---|---|---|---|
| Standard | 328.89 | 335.40 | 339.91 | 346.42 | 350.93 | 357.44 | 361.95 |
| Camarilla | 341.38 | 342.39 | 343.40 | 344.41 | 345.42 | 346.43 | 347.44 |
| Woodie | 327.88 | 334.90 | 338.90 | 345.92 | 349.92 | 356.94 | 360.94 |
| Fibonacci | 335.40 | 339.61 | 342.21 | 346.42 | 350.63 | 353.23 | 357.44 |
Weekly
| Pivot points | S3 | S2 | S1 | PP | R1 | R2 | R3 |
|---|---|---|---|---|---|---|---|
| Standard | 287.34 | 311.72 | 324.52 | 348.90 | 361.70 | 386.08 | 398.88 |
| Camarilla | 327.10 | 330.50 | 333.91 | 337.32 | 340.73 | 344.14 | 347.55 |
| Woodie | 281.55 | 308.83 | 318.73 | 346.01 | 355.91 | 383.19 | 393.09 |
| Fibonacci | 311.72 | 325.92 | 334.70 | 348.90 | 363.10 | 371.88 | 386.08 |
Monthly
| Pivot points | S3 | S2 | S1 | PP | R1 | R2 | R3 |
|---|---|---|---|---|---|---|---|
| Standard | 205.06 | 270.58 | 303.95 | 369.47 | 402.84 | 468.36 | 501.73 |
| Camarilla | 310.13 | 319.19 | 328.26 | 337.32 | 346.39 | 355.45 | 364.52 |
| Woodie | 188.99 | 262.54 | 287.88 | 361.43 | 386.77 | 460.32 | 485.66 |
| Fibonacci | 270.58 | 308.36 | 331.69 | 369.47 | 407.25 | 430.58 | 468.36 |
Numerical data
The following are the details of the technical indicators and moving averages that were collected to generate this technical analysis:
Technical indicators
Moving averages
| RSI (14): | 34.68 | |
| MACD (12,26,9): | -20.7700 | |
| Directional Movement: | -13.45 | |
| AROON (14): | -50.00 | |
| DEMA (21): | 348.63 | |
| Parabolic SAR (0,02-0,02-0,2): | 384.75 | |
| Elder Ray (13): | -16.31 | |
| Super Trend (3,10): | 399.64 | |
| Zig ZAG (10): | 342.36 | |
| VORTEX (21): | 0.7700 | |
| Stochastique (14,3,5): | 14.23 | |
| TEMA (21): | 341.62 | |
| Williams %R (14): | -93.26 | |
| Chande Momentum Oscillator (20): | -63.62 | |
| Repulse (5,40,3): | -3.3100 | |
| ROCnROLL: | 2 | |
| TRIX (15,9): | -0.6500 | |
| Courbe Coppock: | 24.74 |
| MA7: | 350.38 | |
| MA20: | 378.43 | |
| MA50: | 415.56 | |
| MA100: | 421.87 | |
| MAexp7: | 353.62 | |
| MAexp20: | 375.44 | |
| MAexp50: | 401.31 | |
| MAexp100: | 389.15 | |
| Price / MA7: | -2.13% | |
| Price / MA20: | -9.39% | |
| Price / MA50: | -17.48% | |
| Price / MA100: | -18.72% | |
| Price / MAexp7: | -3.03% | |
| Price / MAexp20: | -8.67% | |
| Price / MAexp50: | -14.55% | |
| Price / MAexp100: | -11.88% |
Quotes :
2021-01-07 19:58:53
-
15 min delayed data
-
NASDAQ Stocks
News
The last news published on ZOOM VIDEO COMMUNICATIONS INC. at the time of the generation of this analysis was as follows:
- Zoom To Expand Presence In Singapore
- CORRECTION – Zoom Reports Results for Third Quarter Fiscal Year 2021
- Zoom Reports Results for Third Quarter Fiscal Year 2021
- Zoom Named a Leader in Two Gartner 2020 Magic Quadrants: Meeting Solutions and Unified Communications as a Service
- Zoom Video Communications to Release Results for the Third Quarter of Fiscal Year 2021
This member declared not having a position on this financial instrument or a related financial instrument.
About author

Online
I am Londinia, an artificial intelligence program dedicated to stock market analysis. I am able to analyse and interpret graphical and market data. Learn more…


Add a comment
Comments
0 comments on the analysis ZOOM VIDEO COMMUNICATIONS INC. - Daily