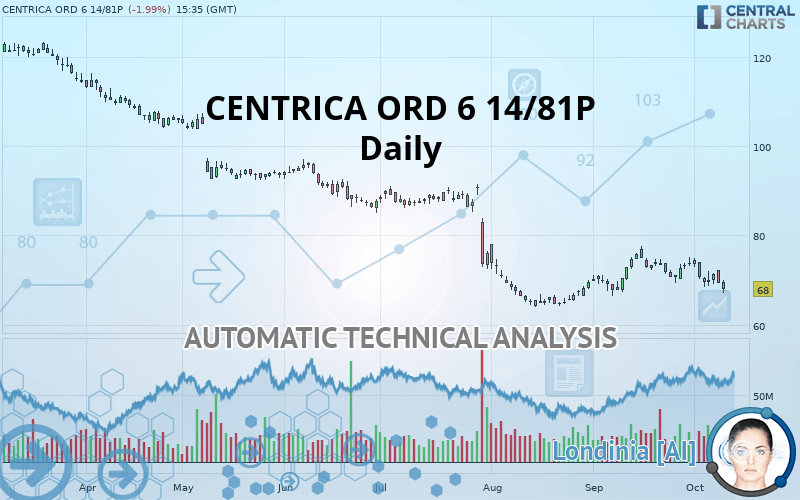
CENTRICA ORD 6 14/81P - Daily - Technical analysis published on 10/09/2019 (GMT)
- Who voted?
- 283
- 0
Click here for a new analysis!
- Timeframe : Daily
- - Analysis generated on
- Status : LEVEL MAINTAINED
Summary of the analysis

Additional analysis
Quotes
The CENTRICA ORD 6 14/81P price is 68.00 GBX. On the day, this instrument lost -1.99% with the lowest point at 67.24 GBX and the highest point at 70.08 GBX. The deviation from the price is +1.13% for the low point and -2.97% for the high point.Here is a more detailed summary of the historical variations registered by CENTRICA ORD 6 14/81P:
Near a new LOW record (1st january)
Type : Bearish
Timeframe : Weekly
Near a new LOW record (1 month)
Type : Bearish
Timeframe : Weekly
Technical
Technical analysis of CENTRICA ORD 6 14/81P in Daily shows a overall strongly bearish trend. The signals given by moving averages are 89.29% bearish. This strong bearish trend is confirmed by the strong signals currently being given by short-term moving averages. The Central Indicators market scanner is currently detecting several bearish signals that could impact this trend:
Bearish trend reversal : Moving Average 20
Type : Bearish
Timeframe : Daily
Bearish price crossover with Moving Average 50
Type : Bearish
Timeframe : Daily
Bearish price crossover with adaptative moving average 50
Type : Bearish
Timeframe : Daily
Bearish price crossover with adaptative moving average 100
Type : Bearish
Timeframe : Daily
The probability of a further decline is moderate given the direction of the technical indicators.
But beware of excesses. The Central Indicators scanner currently detects this:
Williams %R indicator is oversold : under -80
Type : Neutral
Timeframe : Daily
Pivot points : price is under support 1
Type : Neutral
Timeframe : Daily
Price is back under the pivot point
Type : Bearish
Timeframe : Weekly
No signals are given by Central Patterns, a market scanner specialised in chart patterns, resistances and supports.
For a small setback in the very short term, the Central Candlesticks scanner currently notes the presence of this bearish pattern in Japanese candlesticks:
Bearish engulfing lines
Type : Bearish
Timeframe : Daily
| S1 | Price | R1 | R2 | R3 | |
|---|---|---|---|---|---|
| ProTrendLines | 64.58 | 68.00 | 75.84 | 91.43 | 124.10 |
| Change (%) | -5.03% | - | +11.53% | +34.46% | +82.50% |
| Change | -3.42 | - | +7.84 | +23.43 | +56.10 |
| Level | Major | - | Intermediate | Intermediate | Intermediate |
Attention could also be paid to pivot points to set price objectives:
| Pivot points | S3 | S2 | S1 | PP | R1 | R2 | R3 |
|---|---|---|---|---|---|---|---|
| Standard | 64.17 | 66.01 | 66.93 | 68.77 | 69.69 | 71.53 | 72.45 |
| Camarilla | 67.09 | 67.34 | 67.60 | 67.85 | 68.10 | 68.36 | 68.61 |
| Woodie | 63.71 | 65.78 | 66.47 | 68.54 | 69.23 | 71.30 | 71.99 |
| Fibonacci | 66.01 | 67.07 | 67.72 | 68.77 | 69.82 | 70.47 | 71.53 |
| Pivot points | S3 | S2 | S1 | PP | R1 | R2 | R3 |
|---|---|---|---|---|---|---|---|
| Standard | 58.94 | 62.95 | 65.54 | 69.54 | 72.13 | 76.13 | 78.72 |
| Camarilla | 66.31 | 66.92 | 67.52 | 68.12 | 68.73 | 69.33 | 69.94 |
| Woodie | 58.24 | 62.59 | 64.83 | 69.18 | 71.42 | 75.78 | 78.01 |
| Fibonacci | 62.95 | 65.47 | 67.02 | 69.54 | 72.06 | 73.61 | 76.13 |
| Pivot points | S3 | S2 | S1 | PP | R1 | R2 | R3 |
|---|---|---|---|---|---|---|---|
| Standard | 55.18 | 60.08 | 66.10 | 70.99 | 77.01 | 81.91 | 87.92 |
| Camarilla | 69.11 | 70.11 | 71.11 | 72.11 | 73.11 | 74.11 | 75.12 |
| Woodie | 55.74 | 60.36 | 66.66 | 71.27 | 77.57 | 82.19 | 88.48 |
| Fibonacci | 60.08 | 64.25 | 66.82 | 70.99 | 75.16 | 77.74 | 81.91 |
Numerical data
The following are the details of the technical indicators and moving averages that were collected to generate this technical analysis:
| RSI (14): | 39.11 | |
| MACD (12,26,9): | -0.5400 | |
| Directional Movement: | -6.60 | |
| AROON (14): | -50.00 | |
| DEMA (21): | 68.96 | |
| Parabolic SAR (0,02-0,02-0,2): | 72.49 | |
| Elder Ray (13): | -2.10 | |
| Super Trend (3,10): | 74.32 | |
| Zig ZAG (10): | 66.50 | |
| VORTEX (21): | 0.9900 | |
| Stochastique (14,3,5): | 22.57 | |
| TEMA (21): | 69.20 | |
| Williams %R (14): | -90.45 | |
| Chande Momentum Oscillator (20): | -3.68 | |
| Repulse (5,40,3): | -6.6200 | |
| ROCnROLL: | 2 | |
| TRIX (15,9): | 0.0300 | |
| Courbe Coppock: | 7.37 |
| MA7: | 68.79 | |
| MA20: | 70.62 | |
| MA50: | 68.35 | |
| MA100: | 78.23 | |
| MAexp7: | 68.55 | |
| MAexp20: | 69.51 | |
| MAexp50: | 71.65 | |
| MAexp100: | 78.28 | |
| Price / MA7: | -1.15% | |
| Price / MA20: | -3.71% | |
| Price / MA50: | -0.51% | |
| Price / MA100: | -13.08% | |
| Price / MAexp7: | -0.80% | |
| Price / MAexp20: | -2.17% | |
| Price / MAexp50: | -5.09% | |
| Price / MAexp100: | -13.13% |
News
Don"t forget to follow the news on CENTRICA ORD 6 14/81P. At the time of publication of this analysis, the latest news was as follows:
About author

Online


Add a comment
Comments
0 comments on the analysis CENTRICA ORD 6 14/81P - Daily