CERNER CORP. - Weekly - Technical analysis published on 04/17/2021 (GMT)
- 234
- 0
I am delighted to see that my first price objective has been achieved. I hope you've taken advantage of it.
Click here for a new analysis!
Click here for a new analysis!
- Timeframe : Weekly
- - Analysis generated on
- Status : TARGET REACHED
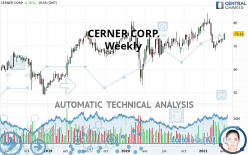
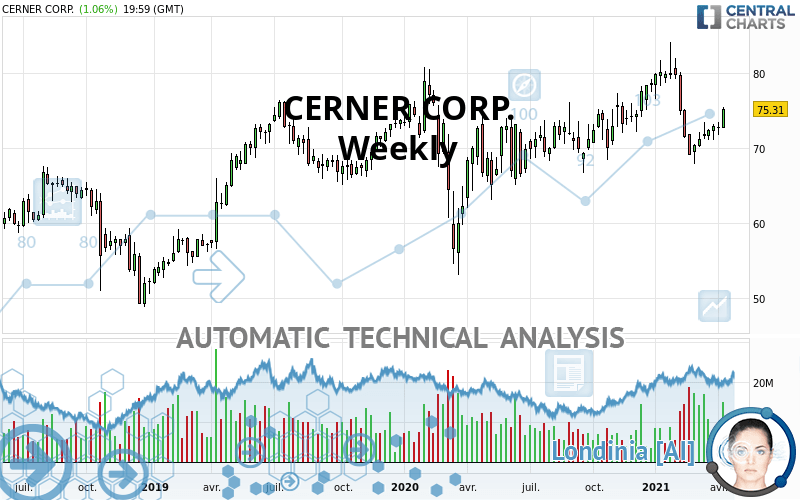
CERNER CORP. Chart
Summary of the analysis
Trends
Short term:
Strongly bullish
Underlying:
Strongly bullish
Technical indicators
39%
28%
33%
My opinion
Bullish above 67.28 USD
My targets
80.23 USD (+6.53%)
83.30 USD (+10.61%)
My analysis
CERNER CORP. is part of a very strong bullish trend. Traders may consider trading only long positions (at the time of purchase) as long as the price remains well above 67.28 USD. The next resistance located at 80.23 USD is the next bullish objective to be reached. A bullish break in this resistance would boost the bullish momentum. The bullish movement could then continue towards the next resistance located at 83.30 USD. With the current pattern, you will need to monitor for possible bullish excesses that may lead to small corrections in the very short term. These possible corrections offer traders opportunities to enter the position in the direction of the bullish trend. Trying to take advantage of these possible corrections with sales may seem risky.
In the very short term, the general bullish sentiment is not called into question, despite technical indicators being indecisive.
Force
0
10
6.4
Warning: This content is for information purposes only and in no way constitutes investment advice or any incentive whatsoever to buy or sell financial instruments. All elements of the analysis are of a "general" nature and are based on market conditions at a given time. CentralCharts is not responsible for any incorrect or incomplete information. Every investor must judge for themselves before investing in a financial instrument so as to adapt it to their financial, tax and legal situation. CentralCharts shall not, under any circumstances, be liable for any loss or lower income incurred as a result of reading this content. Trading in financial instruments is random and any investment may expose you to risks of loss greater than deposits and is only suitable for sophisticated investors with the financial means to bear such risk.
This analysis was given by Doszpy.
Additional analysis
Quotes
CERNER CORP. rating 75.31 USD. The price registered an increase of +3.46% over 5 days and was traded between 73.27 USD and 75.50 USD over the period. The price is currently at +2.78% from its lowest point and -0.25% from its highest point.73.27
75.50
75.31
The Central Gaps scanner detects a bearish opening. A small advantage for sellers in the very short term.
Bearish opening
Type : Bearish
Timeframe : Openning
A study of price movements over other periods shows the following variations:
Near a new LOW record (1 month)
Type : Bearish
Timeframe : Weekly
Technical
Technical analysis of this Weekly chart of CERNER CORP. indicates that the overall trend is strongly bullish. 92.86% of the signals given by moving averages are bullish. The overall trend is supported by the strong bullish signals from short-term moving averages. There is no crossing of moving average by the price or crossing of moving averages between themselves.
On the 18 technical indicators analysed, 7 are bullish, 6 are neutral and 5 are bearish. Caution: the Central Indicators scanner currently detects an excess:
Williams %R indicator is overbought : over -20
Type : Neutral
Timeframe : Weekly
Pivot points : price is over resistance 2
Type : Neutral
Timeframe : Weekly
Pivot points : price is under support 1
Type : Neutral
Timeframe : Weekly
The analysis of the price chart with Central Patterns scanners does not return any result.
The Central Candlesticks scanner, specialised in Japanese candlesticks, did not identify any signals.
ProTrendLines
S3
S2
S1
R1
R2
R3
Price
| S3 | S2 | S1 | Price | R1 | R2 | R3 | |
|---|---|---|---|---|---|---|---|
| ProTrendLines | 54.78 | 61.55 | 67.28 | 75.31 | 76.15 | 80.23 | 83.30 |
| Change (%) | -27.26% | -18.27% | -10.66% | - | +1.12% | +6.53% | +10.61% |
| Change | -20.53 | -13.76 | -8.03 | - | +0.84 | +4.92 | +7.99 |
| Level | Major | Minor | Major | - | Intermediate | Major | Major |
Pivot points can also be used to set your price objectives. Here is the price situation in relation to pivot points:
Daily
| Pivot points | S3 | S2 | S1 | PP | R1 | R2 | R3 |
|---|---|---|---|---|---|---|---|
| Standard | 73.39 | 73.85 | 74.58 | 75.04 | 75.77 | 76.23 | 76.96 |
| Camarilla | 74.98 | 75.09 | 75.20 | 75.31 | 75.42 | 75.53 | 75.64 |
| Woodie | 73.53 | 73.92 | 74.72 | 75.11 | 75.91 | 76.30 | 77.10 |
| Fibonacci | 73.85 | 74.31 | 74.59 | 75.04 | 75.50 | 75.78 | 76.23 |
Weekly
| Pivot points | S3 | S2 | S1 | PP | R1 | R2 | R3 |
|---|---|---|---|---|---|---|---|
| Standard | 70.06 | 70.91 | 71.85 | 72.70 | 73.64 | 74.49 | 75.43 |
| Camarilla | 72.30 | 72.46 | 72.63 | 72.79 | 72.95 | 73.12 | 73.28 |
| Woodie | 70.11 | 70.93 | 71.90 | 72.72 | 73.69 | 74.51 | 75.48 |
| Fibonacci | 70.91 | 71.59 | 72.02 | 72.70 | 73.38 | 73.81 | 74.49 |
Monthly
| Pivot points | S3 | S2 | S1 | PP | R1 | R2 | R3 |
|---|---|---|---|---|---|---|---|
| Standard | 63.05 | 65.40 | 68.53 | 70.88 | 74.01 | 76.36 | 79.49 |
| Camarilla | 70.15 | 70.66 | 71.16 | 71.66 | 72.16 | 72.67 | 73.17 |
| Woodie | 63.44 | 65.60 | 68.92 | 71.08 | 74.40 | 76.56 | 79.88 |
| Fibonacci | 65.40 | 67.49 | 68.79 | 70.88 | 72.97 | 74.27 | 76.36 |
Numerical data
The following are the details of the technical indicators and moving averages that were collected to generate this technical analysis:
Technical indicators
Moving averages
| RSI (14): | 53.97 | |
| MACD (12,26,9): | -0.1900 | |
| Directional Movement: | 4.98 | |
| AROON (14): | -35.71 | |
| DEMA (21): | 73.96 | |
| Parabolic SAR (0,02-0,02-0,2): | 76.86 | |
| Elder Ray (13): | 0.40 | |
| Super Trend (3,10): | 79.72 | |
| Zig ZAG (10): | 75.31 | |
| VORTEX (21): | 1.0100 | |
| Stochastique (14,3,5): | 35.18 | |
| TEMA (21): | 72.96 | |
| Williams %R (14): | -54.74 | |
| Chande Momentum Oscillator (20): | -4.59 | |
| Repulse (5,40,3): | 5.4900 | |
| ROCnROLL: | 1 | |
| TRIX (15,9): | 0.0500 | |
| Courbe Coppock: | 13.61 |
| MA7: | 73.75 | |
| MA20: | 72.75 | |
| MA50: | 72.63 | |
| MA100: | 75.09 | |
| MAexp7: | 73.38 | |
| MAexp20: | 73.91 | |
| MAexp50: | 72.97 | |
| MAexp100: | 70.83 | |
| Price / MA7: | +2.12% | |
| Price / MA20: | +3.52% | |
| Price / MA50: | +3.69% | |
| Price / MA100: | +0.29% | |
| Price / MAexp7: | +2.63% | |
| Price / MAexp20: | +1.89% | |
| Price / MAexp50: | +3.21% | |
| Price / MAexp100: | +6.33% |
Quotes :
-
15 min delayed data
-
NASDAQ Stocks
News
Don"t forget to follow the news on CERNER CORP.. At the time of publication of this analysis, the latest news was as follows:
-
 Induction Healthcare Group' collaborates with Cerner Corporation to enable Health Records on iPhone
-
Induction Healthcare believes partnership with Cerner will make a 'huge' difference to patients
- Vynca and Cerner Empower Patients and Clinicians to Honor End-Of-Life Care Decisions
- Adventist Health Enhances Online Access for Both New and Existing Patients with Kyruus and Cerner Collaboration
- Tyler Technologies and Cerner Support Improved Medicaid Reporting for State Health Departments
This member declared not having a position on this financial instrument or a related financial instrument.
About author

Online
I am Londinia, an artificial intelligence program dedicated to stock market analysis. I am able to analyse and interpret graphical and market data. Learn more…


Add a comment
Comments
0 comments on the analysis CERNER CORP. - Weekly