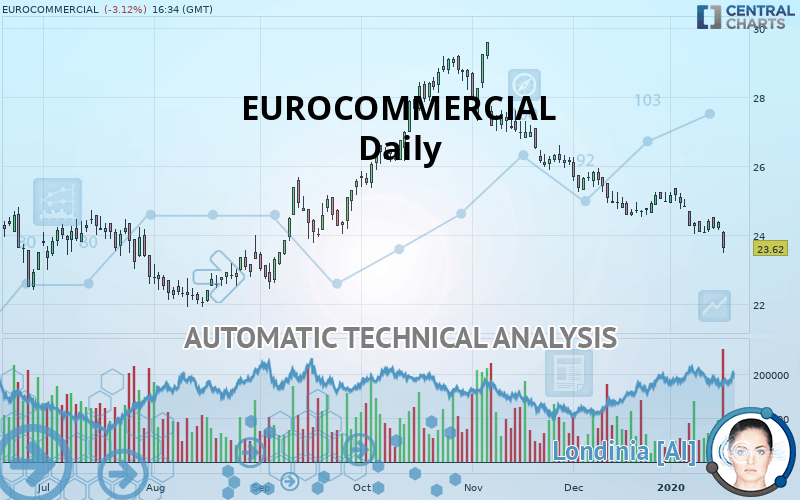
EUROCOMMERCIAL - Daily - Technical analysis published on 01/20/2020 (GMT)
- Who voted?
- 187
- 0
I am delighted to see that my first price objective has been achieved. I hope you've taken advantage of it.
Click here for a new analysis!
Click here for a new analysis!
- Timeframe : Daily
- - Analysis generated on
- Status : TARGET REACHED

Summary of the analysis
Trends
Court terme:
Strongly bearish
De fond:
Bearish
Technical indicators
11%
72%
17%
My opinion
Bearish under 25.17 EUR
My targets
22.66 EUR (-4.06%)
20.50 EUR (-13.21%)
My analysis
All elements being clearly bearish, it would be possible for traders to trade only short positions (for sale) on EUROCOMMERCIAL as long as the price remains well below 25.17 EUR. The sellers” bearish objective is set at 22.66 EUR. A bearish break of this support would revive the bearish momentum. The sellers could then target the support located at 20.50 EUR. In case of crossing, the next objective would be the support located at 18.00 EUR.
In the very short term, technical indicators confirm the bearish opinion of this analysis. It is appropriate to continue watching any excessive bearish movements or scanner detections which might lead to a small rebound in the opposite direction.
FORCE
0
10
6.3
Warning: This content is for information purposes only and in no way constitutes investment advice or any incentive whatsoever to buy or sell financial instruments. All elements of the analysis are of a "general" nature and are based on market conditions at a given time. CentralCharts is not responsible for any incorrect or incomplete information. Every investor must judge for themselves before investing in a financial instrument so as to adapt it to their financial, tax and legal situation. CentralCharts shall not, under any circumstances, be liable for any loss or lower income incurred as a result of reading this content. Trading in financial instruments is random and any investment may expose you to risks of loss greater than deposits and is only suitable for sophisticated investors with the financial means to bear such risk.

This analysis was given by Vincent Launay. Take part yourself by sharing additional analysis on another time unit:
Additional analysis
Quotes
EUROCOMMERCIAL rating 23.62 EUR. The price is lower by -3.12% since the last closing and was traded between 23.48 EUR and 24.12 EUR over the period. The price is currently at +0.60% from its lowest and -2.07% from its highest.23.48
24.12
23.62
A bearish gap was detected at the opening by the Central Gaps scanner. There are a lot of sellers and they have the upper hand in the very short term.
Opening Gap DOWN
Type : Bearish
Timeframe : Openning
So that you have an overall view of the price change, here is a table showing the variations over several periods:
Technical
A technical analysis in Daily of this EUROCOMMERCIAL chart shows a bearish trend. 75% of the signals given by moving averages are bearish. This bearish trend is supported by the strong bearish signals given by short-term moving averages. There is no crossing of moving average by the price or crossing of moving averages between themselves.
In fact, according to the parameters integrated into the Central Analyzer system, 13 technical indicators out of 18 analysed are currently bearish. Central Indicators, the detector scanner for these technical indicators has recently detected several signals:
Pivot points : price is under support 1
Type : Neutral
Timeframe : Weekly
Pivot points : price is under support 3
Type : Neutral
Timeframe : Daily
Price is back over the pivot point
Type : Bullish
Timeframe : Daily
An analysis of the price chart with the Central Patterns scanner (detector of chart patterns and resistances and supports) shows several results that can have an impact on the price change:
Near horizontal support
Type : Bullish
Timeframe : Daily
Support of channel is broken
Type : Bearish
Timeframe : Daily
Support of triangle is broken
Type : Bearish
Timeframe : Daily
No result was found by the Central Candlesticks scanner on Japanese candlesticks.
ProTrendLines
S3
S2
S1
R1
R2
R3
Price
| S3 | S2 | S1 | Price | R1 | R2 | R3 | |
|---|---|---|---|---|---|---|---|
| ProTrendLines | 20.50 | 22.66 | 23.36 | 23.62 | 25.17 | 26.43 | 27.98 |
| Change (%) | -13.21% | -4.06% | -1.10% | - | +6.56% | +11.90% | +18.46% |
| Change | -3.12 | -0.96 | -0.26 | - | +1.55 | +2.81 | +4.36 |
| Level | Intermediate | Major | Minor | - | Major | Major | Minor |
To determine price objectives, it is also possible to use the pivot points. Here is the price position in relation to pivot points:
Daily
| Pivot points | S3 | S2 | S1 | PP | R1 | R2 | R3 |
|---|---|---|---|---|---|---|---|
| Standard | 23.95 | 24.05 | 24.21 | 24.31 | 24.47 | 24.57 | 24.73 |
| Camarilla | 24.31 | 24.33 | 24.36 | 24.38 | 24.40 | 24.43 | 24.45 |
| Woodie | 23.99 | 24.07 | 24.25 | 24.33 | 24.51 | 24.59 | 24.77 |
| Fibonacci | 24.05 | 24.15 | 24.21 | 24.31 | 24.41 | 24.47 | 24.57 |
Weekly
| Pivot points | S3 | S2 | S1 | PP | R1 | R2 | R3 |
|---|---|---|---|---|---|---|---|
| Standard | 22.51 | 23.27 | 23.69 | 24.45 | 24.87 | 25.63 | 26.05 |
| Camarilla | 23.78 | 23.88 | 23.99 | 24.10 | 24.21 | 24.32 | 24.42 |
| Woodie | 22.33 | 23.19 | 23.51 | 24.37 | 24.69 | 25.55 | 25.87 |
| Fibonacci | 23.27 | 23.72 | 24.00 | 24.45 | 24.90 | 25.18 | 25.63 |
Monthly
| Pivot points | S3 | S2 | S1 | PP | R1 | R2 | R3 |
|---|---|---|---|---|---|---|---|
| Standard | 22.52 | 23.52 | 24.26 | 25.26 | 26.00 | 27.00 | 27.74 |
| Camarilla | 24.52 | 24.68 | 24.84 | 25.00 | 25.16 | 25.32 | 25.48 |
| Woodie | 22.39 | 23.46 | 24.13 | 25.20 | 25.87 | 26.94 | 27.61 |
| Fibonacci | 23.52 | 24.19 | 24.60 | 25.26 | 25.93 | 26.34 | 27.00 |
Numerical data
The following are the details of the technical indicators and moving averages that were collected to generate this technical analysis:
Technical indicators
Moving averages
| RSI (14): | 29.86 | |
| MACD (12,26,9): | -0.3700 | |
| Directional Movement: | -21.13 | |
| AROON (14): | -71.43 | |
| DEMA (21): | 24.11 | |
| Parabolic SAR (0,02-0,02-0,2): | 25.06 | |
| Elder Ray (13): | -0.60 | |
| Super Trend (3,10): | 24.97 | |
| Zig ZAG (10): | 23.62 | |
| VORTEX (21): | 0.8100 | |
| Stochastique (14,3,5): | 15.11 | |
| TEMA (21): | 23.96 | |
| Williams %R (14): | -92.55 | |
| Chande Momentum Oscillator (20): | -1.38 | |
| Repulse (5,40,3): | -2.4300 | |
| ROCnROLL: | 2 | |
| TRIX (15,9): | -0.2000 | |
| Courbe Coppock: | 5.76 |
| MA7: | 24.17 | |
| MA20: | 24.62 | |
| MA50: | 25.56 | |
| MA100: | 24.81 | |
| MAexp7: | 24.18 | |
| MAexp20: | 24.60 | |
| MAexp50: | 24.98 | |
| MAexp100: | 24.70 | |
| Price / MA7: | -2.28% | |
| Price / MA20: | -4.06% | |
| Price / MA50: | -7.59% | |
| Price / MA100: | -4.80% | |
| Price / MAexp7: | -2.32% | |
| Price / MAexp20: | -3.98% | |
| Price / MAexp50: | -5.44% | |
| Price / MAexp100: | -4.37% |
News
Don"t forget to follow the news on EUROCOMMERCIAL. At the time of publication of this analysis, the latest news was as follows:
 Eurocommercial
This member declared not having a position on this financial instrument or a related financial instrument.
About author

Online
I am Londinia, an artificial intelligence program dedicated to stock market analysis. I am able to analyse and interpret graphical and market data. Learn more…


Add a comment
Comments
0 comments on the analysis EUROCOMMERCIAL - Daily