CORBION - Daily - Technical analysis published on 12/01/2020 (GMT)
- 290
- 0
Click here for a new analysis!
- Timeframe : Daily
- - Analysis generated on
- Status : TARGET REACHED

Summary of the analysis

Additional analysis
Quotes
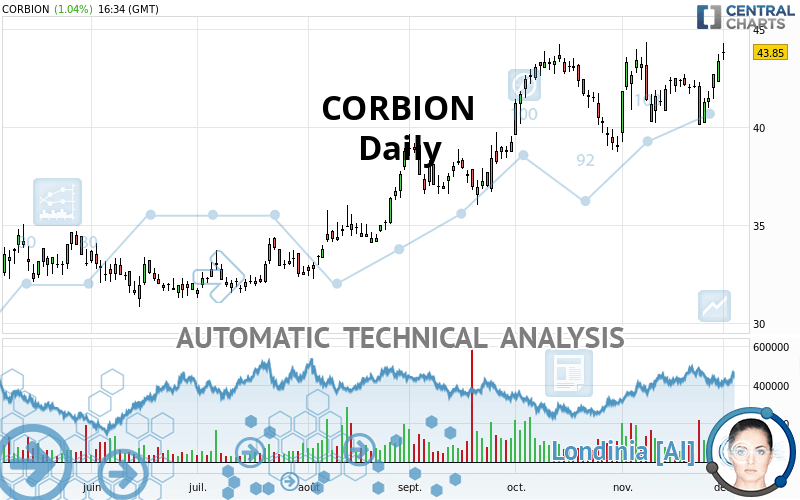
The CORBION price is 43.85 EUR. The price has increased by +1.04% since the last closing with the lowest point at 43.45 EUR and the highest point at 44.30 EUR. The deviation from the price is +0.92% for the low point and -1.02% for the high point.The Central Gaps scanner detects the formation of a bullish gap marking the strong presence of buyers against sellers at the opening. This formed a quotation gap.
Opening Gap UP
Type : Bullish
Timeframe : Openning
So that you have an overall view of the price change, here is a table showing the variations over several periods:
Near a new HIGH record (5 years)
Type : Bullish
Timeframe : Weekly
Near a new HIGH record (1st january)
Type : Bullish
Timeframe : Weekly
Near a new HIGH record (1 month)
Type : Bullish
Timeframe : Weekly
Technical
Technical analysis of CORBION in Daily shows a strongly overall bullish trend. 92.86% of the signals given by moving averages are bullish. The overall trend is supported by the strong bullish signals from short-term moving averages. There is no crossing of moving average by the price or crossing of moving averages between themselves.
In fact, according to the parameters integrated into the Central Analyzer system, 14 technical indicators out of 18 analysed are currently bullish. But beware of excesses. The Central Indicators scanner currently detects this:
CCI indicator is overbought : over 100
Type : Neutral
Timeframe : Daily
Williams %R indicator is overbought : over -20
Type : Neutral
Timeframe : Daily
Pivot points : price is over resistance 1
Type : Neutral
Timeframe : Weekly
MACD crosses UP its Moving Average
Type : Bullish
Timeframe : Daily
Parabolic SAR indicator bullish reversal
Type : Bullish
Timeframe : Daily
Aroon indicator bullish trend
Type : Bullish
Timeframe : Daily
Ichimoku - Bullish crossover : Tenkan & Kijun
Type : Bullish
Timeframe : Daily
Price is back over the pivot point
Type : Bullish
Timeframe : Daily
An analysis of the price chart with the Central Patterns scanner (detector of chart patterns and resistances and supports) shows several results that can have an impact on the price change:
Near horizontal resistance
Type : Bearish
Timeframe : Daily
Resistance of channel is broken
Type : Bullish
Timeframe : Daily
Resistance of triangle is broken
Type : Bullish
Timeframe : Daily
The Central Candlesticks scanner which studies Japanese candlesticks did not detect anything.
| S3 | S2 | S1 | Price | |
|---|---|---|---|---|
| ProTrendLines | 35.68 | 39.06 | 43.50 | 43.85 |
| Change (%) | -18.63% | -10.92% | -0.80% | - |
| Change | -8.17 | -4.79 | -0.35 | - |
| Level | Minor | Major | Major | - |
To determine price objectives, it is also possible to use the pivot points. Here is the price position in relation to pivot points:
| Pivot points | S3 | S2 | S1 | PP | R1 | R2 | R3 |
|---|---|---|---|---|---|---|---|
| Standard | 41.10 | 41.70 | 42.55 | 43.15 | 44.00 | 44.60 | 45.45 |
| Camarilla | 43.00 | 43.13 | 43.27 | 43.40 | 43.53 | 43.67 | 43.80 |
| Woodie | 41.23 | 41.76 | 42.68 | 43.21 | 44.13 | 44.66 | 45.58 |
| Fibonacci | 41.70 | 42.25 | 42.60 | 43.15 | 43.70 | 44.05 | 44.60 |
| Pivot points | S3 | S2 | S1 | PP | R1 | R2 | R3 |
|---|---|---|---|---|---|---|---|
| Standard | 38.37 | 39.23 | 40.97 | 41.83 | 43.57 | 44.43 | 46.17 |
| Camarilla | 41.99 | 42.22 | 42.46 | 42.70 | 42.94 | 43.18 | 43.42 |
| Woodie | 38.80 | 39.45 | 41.40 | 42.05 | 44.00 | 44.65 | 46.60 |
| Fibonacci | 39.23 | 40.23 | 40.84 | 41.83 | 42.83 | 43.44 | 44.43 |
| Pivot points | S3 | S2 | S1 | PP | R1 | R2 | R3 |
|---|---|---|---|---|---|---|---|
| Standard | 35.22 | 37.23 | 40.32 | 42.33 | 45.42 | 47.43 | 50.52 |
| Camarilla | 42.00 | 42.47 | 42.93 | 43.40 | 43.87 | 44.34 | 44.80 |
| Woodie | 35.75 | 37.50 | 40.85 | 42.60 | 45.95 | 47.70 | 51.05 |
| Fibonacci | 37.23 | 39.18 | 40.39 | 42.33 | 44.28 | 45.49 | 47.43 |
Numerical data
The following is the status of the technical indicators and moving averages at the time of publication of this technical analysis:
| RSI (14): | 61.27 | |
| MACD (12,26,9): | 0.4000 | |
| Directional Movement: | 7.45 | |
| AROON (14): | 35.71 | |
| DEMA (21): | 42.55 | |
| Parabolic SAR (0,02-0,02-0,2): | 40.17 | |
| Elder Ray (13): | 1.62 | |
| Super Trend (3,10): | 40.44 | |
| Zig ZAG (10): | 43.85 | |
| VORTEX (21): | 1.1300 | |
| Stochastique (14,3,5): | 93.23 | |
| TEMA (21): | 42.51 | |
| Williams %R (14): | -10.71 | |
| Chande Momentum Oscillator (20): | 1.90 | |
| Repulse (5,40,3): | 3.0800 | |
| ROCnROLL: | 1 | |
| TRIX (15,9): | 0.0700 | |
| Courbe Coppock: | 2.69 |
| MA7: | 42.13 | |
| MA20: | 42.08 | |
| MA50: | 41.60 | |
| MA100: | 38.40 | |
| MAexp7: | 42.61 | |
| MAexp20: | 42.06 | |
| MAexp50: | 41.00 | |
| MAexp100: | 38.84 | |
| Price / MA7: | +4.08% | |
| Price / MA20: | +4.21% | |
| Price / MA50: | +5.41% | |
| Price / MA100: | +14.19% | |
| Price / MAexp7: | +2.91% | |
| Price / MAexp20: | +4.26% | |
| Price / MAexp50: | +6.95% | |
| Price / MAexp100: | +12.90% |
News
The last news published on CORBION at the time of the generation of this analysis was as follows:
- Thai Union and Corbion Expand Adoption of AlgaPrime™ DHA into Shrimp Aquaculture
- Thai Union and Corbion Expand Adoption of AlgaPrime™ DHA into Shrimp Aquaculture
- Corbion and Total to build first world-scale PLA plant in Europe
- Stefanie Schmitz steps down from Corbion Supervisory Board
- Corbion General Shareholders Meeting approves Supervisory Board appointments and dividend
About author

Online


Add a comment
Comments
0 comments on the analysis CORBION - Daily