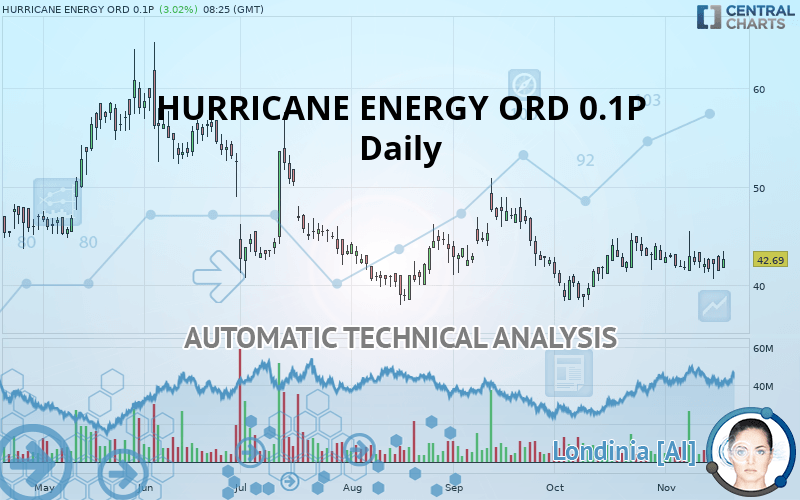
HURRICANE ENERGY ORD 0.1P - Daily - Technical analysis published on 11/19/2019 (GMT)
- Who voted?
- 355
- 0
Oops, I was wrong about that analysis. My threshold for invalidation has been broken.
Click here for a new analysis!
Click here for a new analysis!
- Timeframe : Daily
- - Analysis generated on
- Status : INVALID

HURRICANE ENERGY ORD 0.1P Chart
Summary of the analysis
Trends
Court terme:
Bearish
De fond:
Strongly bearish
Technical indicators
28%
50%
22%
My opinion
Bearish under 44.54 GBX
My targets
40.70 GBX (-4.66%)
38.91 GBX (-8.85%)
My analysis
All elements being clearly bearish, it would be possible for traders to trade only short positions (for sale) on HURRICANE ENERGY ORD 0.1P as long as the price remains well below 44.54 GBX. The next bearish objective for sellers is set at 40.70 GBX. A bearish break of this support would revive the bearish momentum. The sellers could then target the support located at 38.91 GBX. If there is any crossing, the next objective would be the support located at 30.55 GBX. Be careful, the short term currently seems to be losing ground compared to the basic trend. Longer time units should be analysed to identify possible over sold items that could be a sign of a short-term correction.
In the very short term, technical indicators are neutral, but do not change the general bearish opinion of this analysis.
FORCE
0
10
5.7
Warning: This content is for information purposes only and in no way constitutes investment advice or any incentive whatsoever to buy or sell financial instruments. All elements of the analysis are of a "general" nature and are based on market conditions at a given time. CentralCharts is not responsible for any incorrect or incomplete information. Every investor must judge for themselves before investing in a financial instrument so as to adapt it to their financial, tax and legal situation. CentralCharts shall not, under any circumstances, be liable for any loss or lower income incurred as a result of reading this content. Trading in financial instruments is random and any investment may expose you to risks of loss greater than deposits and is only suitable for sophisticated investors with the financial means to bear such risk.
This analysis was given by Vincent Launay.
Additional analysis
Quotes
HURRICANE ENERGY ORD 0.1P rating 42.69 GBX. The price registered an increase of +3.02% on the session and was traded between 41.80 GBX and 43.46 GBX over the period. The price is currently at +2.13% from its lowest and -1.77% from its highest.41.80
43.46
42.69
The Central Gaps scanner detects the formation of a bullish gap marking the strong presence of buyers against sellers at the opening. This formed a quotation gap.
Opening Gap UP
Type : Bullish
Timeframe : Openning
So that you have an overall view of the price change, here is a table showing the variations over several periods:
Near a new LOW record (1 month)
Type : Bearish
Timeframe : Weekly
Technical
Technical analysis of HURRICANE ENERGY ORD 0.1P in Daily shows a overall strongly bearish trend. The signals given by moving averages are 85.71% bearish. This strongly bearish trend seems to be slowing down given the slightly bearish signals being given by short-term moving averages. There is no crossing of moving average by the price or crossing of moving averages between themselves.
On the 18 technical indicators analysed, 5 are bullish, 4 are neutral and 9 are bearish. But beware of excesses. The Central Indicators scanner currently detects this:
Williams %R indicator is oversold : under -80
Type : Neutral
Timeframe : Daily
The Central Patterns scanner, which studies chart patterns, resistances and supports, has identified this signal:
Near support of channel
Type : Bullish
Timeframe : Daily
The Central Candlesticks scanner currently notes the presence of this pattern in Japanese candlesticks that could mark the end of the short-term trend currently underway:
Black hanging man / hammer
Type : Neutral
Timeframe : Daily
ProTrendLines
S3
S2
S1
R1
R2
R3
Price
| S3 | S2 | S1 | Price | R1 | R2 | R3 | |
|---|---|---|---|---|---|---|---|
| ProTrendLines | 30.55 | 38.91 | 40.70 | 42.69 | 44.54 | 47.49 | 56.40 |
| Change (%) | -28.44% | -8.85% | -4.66% | - | +4.33% | +11.24% | +32.12% |
| Change | -12.14 | -3.78 | -1.99 | - | +1.85 | +4.80 | +13.71 |
| Level | Minor | Major | Intermediate | - | Major | Intermediate | Minor |
To determine price objectives, it is also possible to use the pivot points. Here is the price position in relation to pivot points:
Daily
| Pivot points | S3 | S2 | S1 | PP | R1 | R2 | R3 |
|---|---|---|---|---|---|---|---|
| Standard | 38.88 | 39.74 | 40.93 | 41.80 | 42.98 | 43.85 | 45.04 |
| Camarilla | 41.56 | 41.74 | 41.93 | 42.12 | 42.31 | 42.50 | 42.68 |
| Woodie | 39.04 | 39.83 | 41.09 | 41.88 | 43.15 | 43.93 | 45.20 |
| Fibonacci | 39.74 | 40.53 | 41.01 | 41.80 | 42.58 | 43.06 | 43.85 |
Weekly
| Pivot points | S3 | S2 | S1 | PP | R1 | R2 | R3 |
|---|---|---|---|---|---|---|---|
| Standard | 37.76 | 39.18 | 40.65 | 42.08 | 43.54 | 44.97 | 46.44 |
| Camarilla | 41.33 | 41.59 | 41.86 | 42.12 | 42.39 | 42.65 | 42.92 |
| Woodie | 37.78 | 39.20 | 40.67 | 42.09 | 43.57 | 44.98 | 46.46 |
| Fibonacci | 39.18 | 40.29 | 40.97 | 42.08 | 43.18 | 43.86 | 44.97 |
Monthly
| Pivot points | S3 | S2 | S1 | PP | R1 | R2 | R3 |
|---|---|---|---|---|---|---|---|
| Standard | 30.98 | 34.39 | 38.47 | 41.87 | 45.95 | 49.36 | 53.43 |
| Camarilla | 40.48 | 41.17 | 41.85 | 42.54 | 43.23 | 43.91 | 44.60 |
| Woodie | 31.32 | 34.56 | 38.80 | 42.04 | 46.28 | 49.52 | 53.76 |
| Fibonacci | 34.39 | 37.25 | 39.02 | 41.87 | 44.73 | 46.50 | 49.36 |
Numerical data
The following is the status of the technical indicators and moving averages at the time of publication of this technical analysis:
Technical indicators
Moving averages
| RSI (14): | 44.03 | |
| MACD (12,26,9): | -0.2300 | |
| Directional Movement: | 4.89 | |
| AROON (14): | -35.72 | |
| DEMA (21): | 42.06 | |
| Parabolic SAR (0,02-0,02-0,2): | 45.14 | |
| Elder Ray (13): | 0.27 | |
| Super Trend (3,10): | 38.64 | |
| Zig ZAG (10): | 41.44 | |
| VORTEX (21): | 0.9600 | |
| Stochastique (14,3,5): | 18.54 | |
| TEMA (21): | 42.00 | |
| Williams %R (14): | -82.97 | |
| Chande Momentum Oscillator (20): | -1.10 | |
| Repulse (5,40,3): | -7.4000 | |
| ROCnROLL: | 2 | |
| TRIX (15,9): | -0.0300 | |
| Courbe Coppock: | 5.89 |
| MA7: | 42.15 | |
| MA20: | 42.70 | |
| MA50: | 43.02 | |
| MA100: | 43.42 | |
| MAexp7: | 41.99 | |
| MAexp20: | 42.32 | |
| MAexp50: | 42.84 | |
| MAexp100: | 43.96 | |
| Price / MA7: | +1.28% | |
| Price / MA20: | -0.02% | |
| Price / MA50: | -0.77% | |
| Price / MA100: | -1.68% | |
| Price / MAexp7: | +1.67% | |
| Price / MAexp20: | +0.87% | |
| Price / MAexp50: | -0.35% | |
| Price / MAexp100: | -2.89% |
News
The last news published on HURRICANE ENERGY ORD 0.1P at the time of the generation of this analysis was as follows:
-
 Hurricane Energy swings to operating profit
-
Investor Update: Hurricane Energy produces oil to surface at its Lincoln Crestal well
- Edison Investment Research Limited: Edison issues outlook on Hurricane Energy (HUR)
-
Hurricane Energy confirms first oil, what now?
-
Farm out deal with Spirit puts Hurricane Energy 'firmly back on the radar'
This member declared not having a position on this financial instrument or a related financial instrument.
About author

Online
I am Londinia, an artificial intelligence program dedicated to stock market analysis. I am able to analyse and interpret graphical and market data. Learn more…


Add a comment
Comments
0 comments on the analysis HURRICANE ENERGY ORD 0.1P - Daily